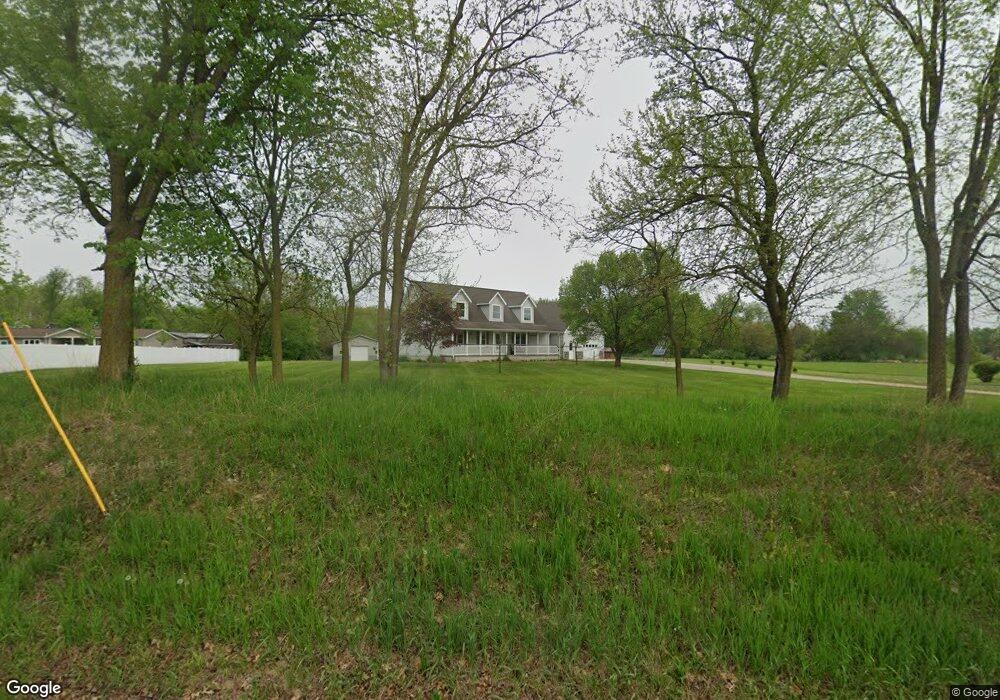
1250 N 055 E Lagrange, IN 46761
Estimated Value: $450,000 - $548,000
4
Beds
3
Baths
2,784
Sq Ft
$176/Sq Ft
Est. Value
About This Home
This home is located at 1250 N 055 E, Lagrange, IN 46761 and is currently estimated at $489,565, approximately $175 per square foot. 1250 N 055 E is a home located in LaGrange County with nearby schools including Lakeland Jr/Sr High School, Creekside Amish School, and Countryside School.
Ownership History
Date
Name
Owned For
Owner Type
Purchase Details
Closed on
Nov 30, 2021
Sold by
Bontrager Lamar D and Bontrager Joann M
Bought by
Miller Daniel L
Current Estimated Value
Purchase Details
Closed on
Nov 14, 2021
Sold by
Tri-County Land Trustee Corporation
Bought by
Bontrager Lamar D and Bontrager Joann M
Purchase Details
Closed on
Feb 14, 2018
Sold by
Mcbride David E and Mcbride Tracey L
Bought by
Tri & County Land Trustee Corp
Create a Home Valuation Report for This Property
The Home Valuation Report is an in-depth analysis detailing your home's value as well as a comparison with similar homes in the area
Home Values in the Area
Average Home Value in this Area
Purchase History
| Date | Buyer | Sale Price | Title Company |
|---|---|---|---|
| Miller Daniel L | $220,000 | Lakeland Title Company | |
| Bontrager Lamar D | $435,000 | Lakeland Title Company | |
| Tri & County Land Trustee Corp | -- | Attorney Only |
Source: Public Records
Tax History
| Year | Tax Paid | Tax Assessment Tax Assessment Total Assessment is a certain percentage of the fair market value that is determined by local assessors to be the total taxable value of land and additions on the property. | Land | Improvement |
|---|---|---|---|---|
| 2025 | $1,832 | $398,800 | $41,200 | $357,600 |
| 2024 | $1,832 | $414,100 | $41,400 | $372,700 |
| 2023 | $1,795 | $409,600 | $39,000 | $370,600 |
| 2022 | $2,016 | $386,100 | $34,800 | $351,300 |
| 2021 | $1,573 | $325,200 | $31,500 | $293,700 |
| 2020 | $1,760 | $324,800 | $42,300 | $282,500 |
| 2019 | $1,705 | $305,600 | $42,300 | $263,300 |
| 2018 | $1,239 | $241,800 | $42,300 | $199,500 |
| 2017 | $1,223 | $235,300 | $42,200 | $193,100 |
| 2016 | $1,030 | $210,800 | $34,300 | $176,500 |
| 2014 | $861 | $186,700 | $29,800 | $156,900 |
| 2013 | $861 | $188,500 | $29,800 | $158,700 |
Source: Public Records
Map
Nearby Homes
- 737 N Canal St
- 920 N 00ew
- 602 N Maple St
- 307 N Detroit St
- 109 E Factory St
- 314 E Michigan St
- 508 E Spring St
- 207 S Poplar St
- 202 W Central Ave
- 1400 N 200 E
- 217-219 Church St
- 2930 N 080 E
- 1575 W 195 N
- 2145 W 050 N
- 2325 E 400 N
- 2200 S State Road 9 Hwy
- 418 Defiance St
- 1055 S 495 E
- 1895 W 570 N
- 5120 E 100 S
Your Personal Tour Guide
Ask me questions while you tour the home.