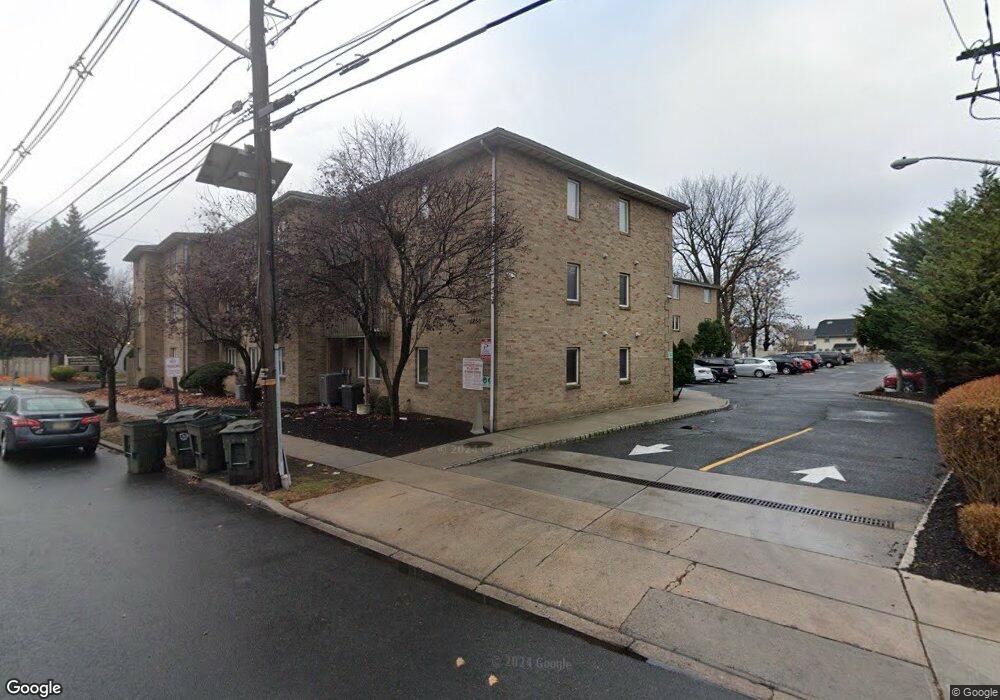
1250 N Broad St Unit C3 Hillside, NJ 07205
Westminster NeighborhoodEstimated Value: $235,000 - $360,000
Studio
--
Bath
1,092
Sq Ft
$261/Sq Ft
Est. Value
About This Home
This home is located at 1250 N Broad St Unit C3, Hillside, NJ 07205 and is currently estimated at $284,671, approximately $260 per square foot. 1250 N Broad St Unit C3 is a home located in Union County with nearby schools including Abram P. Morris-Saybrook Elementary School, Hurden Looker School, and Ola Edwards Community School.
Ownership History
Date
Name
Owned For
Owner Type
Purchase Details
Closed on
Oct 26, 2020
Sold by
Molina Hipolita
Bought by
Molina Misael
Current Estimated Value
Purchase Details
Closed on
Jun 20, 2017
Sold by
Deutsche Bank National Trust Company
Bought by
Molina Hipolita
Purchase Details
Closed on
Jan 22, 2016
Sold by
Union County Sheriff
Bought by
Deutsche Bank National Trust Compan
Purchase Details
Closed on
Feb 20, 2013
Sold by
Froehlich Ralph
Bought by
Hillside Commons Condominium Association
Purchase Details
Closed on
Oct 27, 2006
Sold by
Davis Flossie
Bought by
Erlande Pepe
Home Financials for this Owner
Home Financials are based on the most recent Mortgage that was taken out on this home.
Original Mortgage
$168,000
Interest Rate
6.35%
Create a Home Valuation Report for This Property
The Home Valuation Report is an in-depth analysis detailing your home's value as well as a comparison with similar homes in the area
Home Values in the Area
Average Home Value in this Area
Purchase History
| Date | Buyer | Sale Price | Title Company |
|---|---|---|---|
| Molina Misael | -- | None Available | |
| Molina Hipolita | $80,764 | Premium Title Services Inc | |
| Deutsche Bank National Trust Compan | $1,000 | -- | |
| Hillside Commons Condominium Association | $241,202 | Chicago Title Insurnce Co | |
| Erlande Pepe | $210,000 | -- |
Source: Public Records
Mortgage History
| Date | Status | Borrower | Loan Amount |
|---|---|---|---|
| Previous Owner | Erlande Pepe | $168,000 |
Source: Public Records
Tax History
| Year | Tax Paid | Tax Assessment Tax Assessment Total Assessment is a certain percentage of the fair market value that is determined by local assessors to be the total taxable value of land and additions on the property. | Land | Improvement |
|---|---|---|---|---|
| 2025 | $5,620 | $68,100 | $10,600 | $57,500 |
| 2024 | $5,457 | $68,100 | $10,600 | $57,500 |
| 2023 | $5,457 | $68,100 | $10,600 | $57,500 |
| 2022 | $5,406 | $68,100 | $10,600 | $57,500 |
| 2021 | $5,371 | $68,100 | $10,600 | $57,500 |
| 2020 | $5,340 | $68,100 | $10,600 | $57,500 |
| 2019 | $5,236 | $68,100 | $10,600 | $57,500 |
| 2018 | $5,184 | $68,100 | $10,600 | $57,500 |
| 2017 | $5,152 | $68,100 | $10,600 | $57,500 |
| 2016 | $5,146 | $68,100 | $10,600 | $57,500 |
| 2015 | $5,101 | $68,100 | $10,600 | $57,500 |
| 2014 | $5,020 | $68,100 | $10,600 | $57,500 |
Source: Public Records
Map
Nearby Homes
- 1250 N Broad St Unit A1
- 1229 Robert St
- 24 Hollywood Ave
- 1204 Salem Ave
- 1200 Salem Ave
- 137 Fairbanks St
- 161 Virginia St
- 1408 Lexington Place Unit 1410
- 124 Woodruff Place
- 1444 N Broad St
- 1379 Garfield Place
- 75 Hillside Ave
- 1018 John Glenn Dr
- 345 Sanford Ave
- 1038 Fairview Place
- 17 Country Club Ln
- 1504 Munn Ave
- 904 Cross Ave
- 1318 State St
- 111 Hanford St
- 1250 N Broad St Unit A10
- 1250 N Broad St Unit C1
- 1250 N Broad St Unit B10
- 1250 N Broad St Unit A6
- 1250 N Broad St Unit C10
- 1250 N Broad St Unit C8
- 1250 N Broad St Unit B3
- 1250 N Broad St Unit B4
- 1250 N Broad St Unit A5
- 1250 N Broad St Unit C9
- 1250 N Broad St Unit C2
- 1250 N Broad St Unit C7
- 1250 N Broad St Unit C6
- 1250 N Broad St Unit C5
- 1250 N Broad St Unit C4
- 1250 N Broad St Unit B9
- 1250 N Broad St Unit B8
- 1250 N Broad St Unit B7
- 1250 N Broad St Unit B6
- 1250 N Broad St Unit B5
Your Personal Tour Guide
Ask me questions while you tour the home.