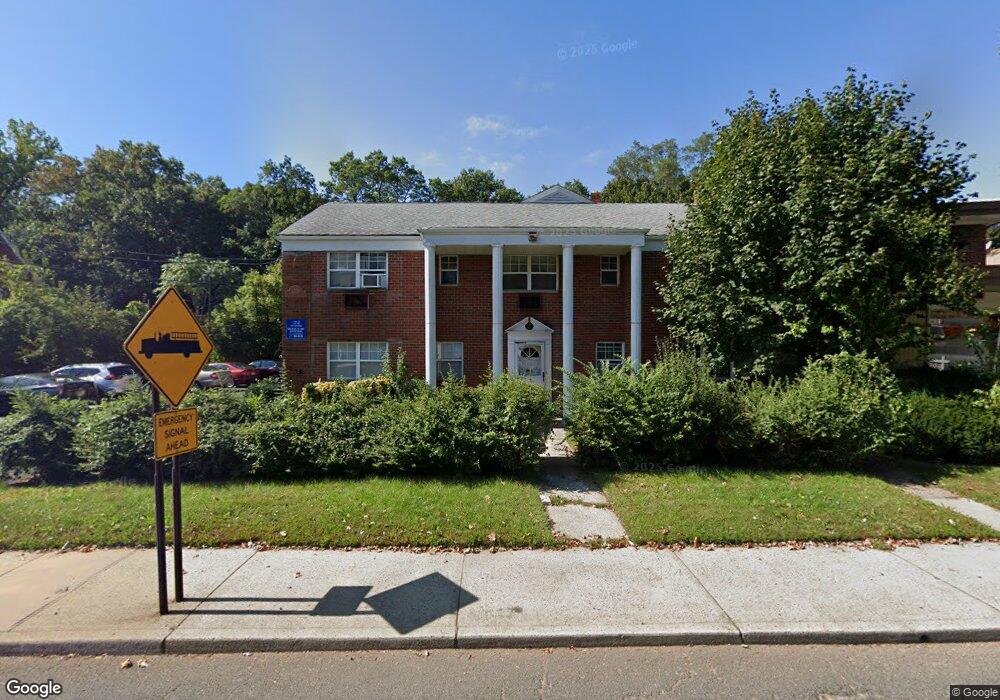
1250 Teaneck Rd Unit 17 Teaneck, NJ 07666
Estimated Value: $296,138 - $525,000
2
Beds
1
Bath
953
Sq Ft
$387/Sq Ft
Est. Value
About This Home
This home is located at 1250 Teaneck Rd Unit 17, Teaneck, NJ 07666 and is currently estimated at $368,785, approximately $386 per square foot. 1250 Teaneck Rd Unit 17 is a home located in Bergen County with nearby schools including Teaneck Senior High School, Wilbert F Mays Seventh-Day Adventist School, and Yeshivat He'atid.
Ownership History
Date
Name
Owned For
Owner Type
Purchase Details
Closed on
Aug 21, 2019
Sold by
Johnson Nakia B and Johnson Wendell L
Bought by
Hewitt Khadeen K and Stephenson Khaleel A
Current Estimated Value
Purchase Details
Closed on
Sep 12, 2008
Sold by
Chehab Patricia and Chehab Ahmed
Bought by
Johnson Nakia B
Purchase Details
Closed on
May 12, 2006
Sold by
Bello Michael
Bought by
Chehab Patricia
Home Financials for this Owner
Home Financials are based on the most recent Mortgage that was taken out on this home.
Original Mortgage
$192,000
Interest Rate
6.67%
Purchase Details
Closed on
Jan 28, 2002
Sold by
Hadnott Glenda P
Bought by
Bello Michael and Maldonado Jerris
Home Financials for this Owner
Home Financials are based on the most recent Mortgage that was taken out on this home.
Original Mortgage
$110,457
Interest Rate
7.13%
Mortgage Type
FHA
Create a Home Valuation Report for This Property
The Home Valuation Report is an in-depth analysis detailing your home's value as well as a comparison with similar homes in the area
Home Values in the Area
Average Home Value in this Area
Purchase History
| Date | Buyer | Sale Price | Title Company |
|---|---|---|---|
| Hewitt Khadeen K | $233,000 | -- | |
| Johnson Nakia B | $267,000 | -- | |
| Chehab Patricia | $240,000 | -- | |
| Bello Michael | $113,000 | -- |
Source: Public Records
Mortgage History
| Date | Status | Borrower | Loan Amount |
|---|---|---|---|
| Previous Owner | Chehab Patricia | $192,000 | |
| Previous Owner | Bello Michael | $110,457 |
Source: Public Records
Tax History Compared to Growth
Tax History
| Year | Tax Paid | Tax Assessment Tax Assessment Total Assessment is a certain percentage of the fair market value that is determined by local assessors to be the total taxable value of land and additions on the property. | Land | Improvement |
|---|---|---|---|---|
| 2025 | $5,032 | $230,400 | $125,000 | $105,400 |
| 2024 | $4,689 | $230,400 | $125,000 | $105,400 |
| 2023 | $4,597 | $142,000 | $75,000 | $67,000 |
| 2022 | $4,597 | $142,000 | $75,000 | $67,000 |
| 2021 | $4,624 | $142,000 | $75,000 | $67,000 |
| 2020 | $4,592 | $142,000 | $75,000 | $67,000 |
| 2019 | $4,540 | $142,000 | $75,000 | $67,000 |
| 2018 | $4,506 | $142,000 | $75,000 | $67,000 |
| 2017 | $4,463 | $142,000 | $75,000 | $67,000 |
| 2016 | $4,396 | $142,000 | $75,000 | $67,000 |
| 2015 | $4,327 | $142,000 | $75,000 | $67,000 |
| 2014 | $6,034 | $234,700 | $100,000 | $134,700 |
Source: Public Records
Map
Nearby Homes
- 72 Church St
- 1329 Teaneck Rd
- 81 Franklin Rd
- 83 E Forest Ave
- 110 Fairview Ave
- 1153 Queen Anne Rd
- 1470 Gaylord Terrace
- 1141 Tuxedo Square
- 1485 Gaylord Terrace
- 1470 W Terrace Cir Unit 4
- 1495 E Terrace Cir Unit 1
- 995 Teaneck Rd Unit 3N
- 985 Teaneck Rd Unit 1J
- 35 Amsterdam Ave
- 152 Washington Place
- 948 Prince St
- 302 W Forest Ave
- 1328 Taft Rd
- 927 Commonwealth Dr Unit 4
- 72 Oak St
- 1250 Teaneck Rd
- 1250 Teaneck Rd
- 1250 Teaneck Rd
- 1250 Teaneck Rd
- 1250 Teaneck Rd
- 1250 Teaneck Rd
- 1250 Teaneck Rd
- 1250 Teaneck Rd
- 1250 Teaneck Rd Unit 4
- 1250 Teaneck Rd
- 1250 Teaneck Rd
- 1250 Teaneck Rd Unit C0016
- 1250 Teaneck Rd
- 1250 Teaneck Rd
- 1250 Teaneck Rd
- 1250 Teaneck Rd
- 1250 Teaneck Rd
- 1250 Teaneck Rd
- 1250 Teaneck Rd
- 1250 Teaneck Rd Unit 16