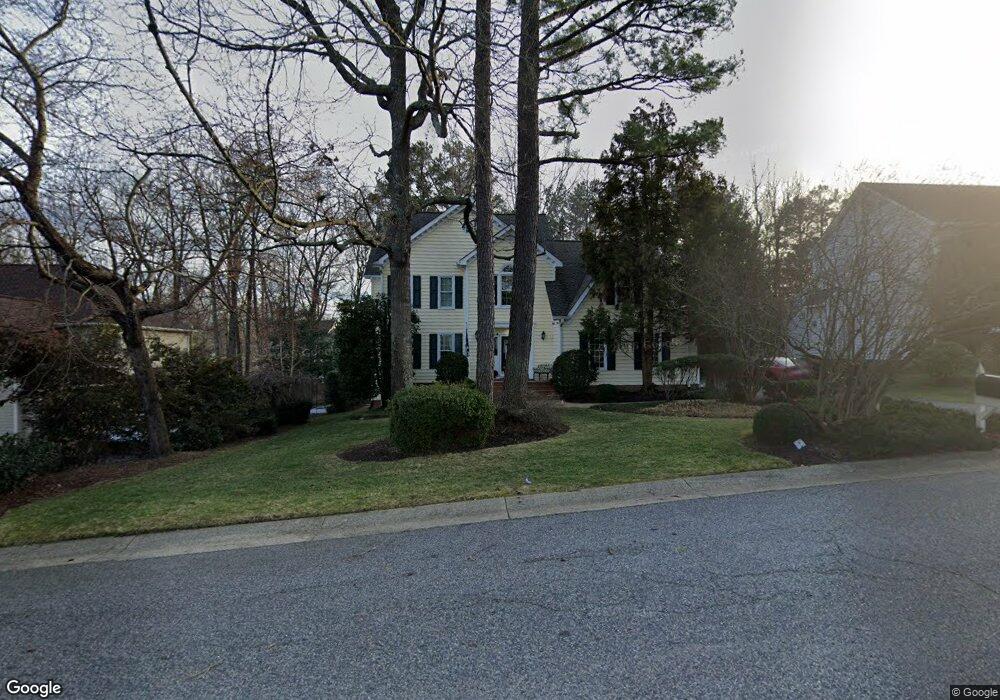
12501 Triton Springs Dr Midlothian, VA 23114
Estimated Value: $599,007 - $633,000
5
Beds
3
Baths
3,100
Sq Ft
$200/Sq Ft
Est. Value
About This Home
This home is located at 12501 Triton Springs Dr, Midlothian, VA 23114 and is currently estimated at $618,502, approximately $199 per square foot. 12501 Triton Springs Dr is a home located in Chesterfield County with nearby schools including Evergreen Elementary, Tomahawk Creek Middle School, and Midlothian High School.
Ownership History
Date
Name
Owned For
Owner Type
Purchase Details
Closed on
Jul 29, 2002
Sold by
Lezon Jonathan L
Bought by
Keblusek Charles W and Keblusek Virginia
Current Estimated Value
Home Financials for this Owner
Home Financials are based on the most recent Mortgage that was taken out on this home.
Original Mortgage
$145,000
Outstanding Balance
$62,146
Interest Rate
6.73%
Mortgage Type
New Conventional
Estimated Equity
$556,356
Purchase Details
Closed on
Nov 18, 1998
Sold by
Peterson John S and Peterson Denise F
Bought by
Lezon Jonathan L and Lezon Tonja L
Home Financials for this Owner
Home Financials are based on the most recent Mortgage that was taken out on this home.
Original Mortgage
$189,000
Interest Rate
6.49%
Mortgage Type
New Conventional
Create a Home Valuation Report for This Property
The Home Valuation Report is an in-depth analysis detailing your home's value as well as a comparison with similar homes in the area
Home Values in the Area
Average Home Value in this Area
Purchase History
| Date | Buyer | Sale Price | Title Company |
|---|---|---|---|
| Keblusek Charles W | $270,000 | -- | |
| Lezon Jonathan L | $237,000 | -- |
Source: Public Records
Mortgage History
| Date | Status | Borrower | Loan Amount |
|---|---|---|---|
| Open | Lezon Jonathan L | $145,000 | |
| Previous Owner | Lezon Jonathan L | $189,000 |
Source: Public Records
Tax History Compared to Growth
Tax History
| Year | Tax Paid | Tax Assessment Tax Assessment Total Assessment is a certain percentage of the fair market value that is determined by local assessors to be the total taxable value of land and additions on the property. | Land | Improvement |
|---|---|---|---|---|
| 2025 | $5,342 | $597,400 | $83,000 | $514,400 |
| 2024 | $5,342 | $536,600 | $78,000 | $458,600 |
| 2023 | $4,534 | $498,200 | $76,000 | $422,200 |
| 2022 | $4,078 | $443,300 | $74,000 | $369,300 |
| 2021 | $3,592 | $375,500 | $72,000 | $303,500 |
| 2020 | $3,567 | $375,500 | $72,000 | $303,500 |
| 2019 | $3,546 | $373,300 | $72,000 | $301,300 |
| 2018 | $3,453 | $363,500 | $68,000 | $295,500 |
| 2017 | $3,159 | $329,100 | $68,000 | $261,100 |
| 2016 | $3,140 | $327,100 | $66,000 | $261,100 |
| 2015 | $3,220 | $332,800 | $66,000 | $266,800 |
| 2014 | $3,067 | $316,900 | $64,000 | $252,900 |
Source: Public Records
Map
Nearby Homes
- 914 Spirea Rd
- 1001 Worsham Green Terrace
- 1400 Cedar Crossing Trail
- 11630 Smoketree Dr
- 11970 Lucks Ln
- 1406 Walton Bluff Terrace
- 11960 Lucks Ln
- 11950 Lucks Ln
- 1301 Wesanne Ln
- 11520 Old Carrollton Ct
- 11506 Glenmont Rd
- 12601 Cottage Mill Rd
- 11907 Exbury Ct
- 1407 Sycamore Ridge Ct
- 11933 Exbury Terrace
- 11603 Durrington Dr
- 12831 Ashtree Rd
- 419 Walton Park Rd
- 11761 Edenberry Dr
- 12918 Ashtree Rd
- 12503 Triton Springs Dr
- 12407 Triton Springs Dr
- 12520 Walton Lake Dr
- 12518 Walton Lake Dr
- 12505 Triton Springs Dr
- 12405 Triton Springs Dr
- 12522 Walton Lake Dr
- 12500 Triton Springs Dr
- 12502 Triton Springs Dr
- 12504 Triton Springs Dr
- 12524 Walton Lake Dr
- 12300 Queensgate Rd
- 12516 Walton Lake Dr
- 12507 Triton Springs Dr
- 12403 Triton Springs Dr
- 12506 Triton Springs Dr
- 12600 Walton Lake Dr
- 12404 Triton Springs Dr
- 12501 Rocky River Dr
- 12500 Walton Lake Dr