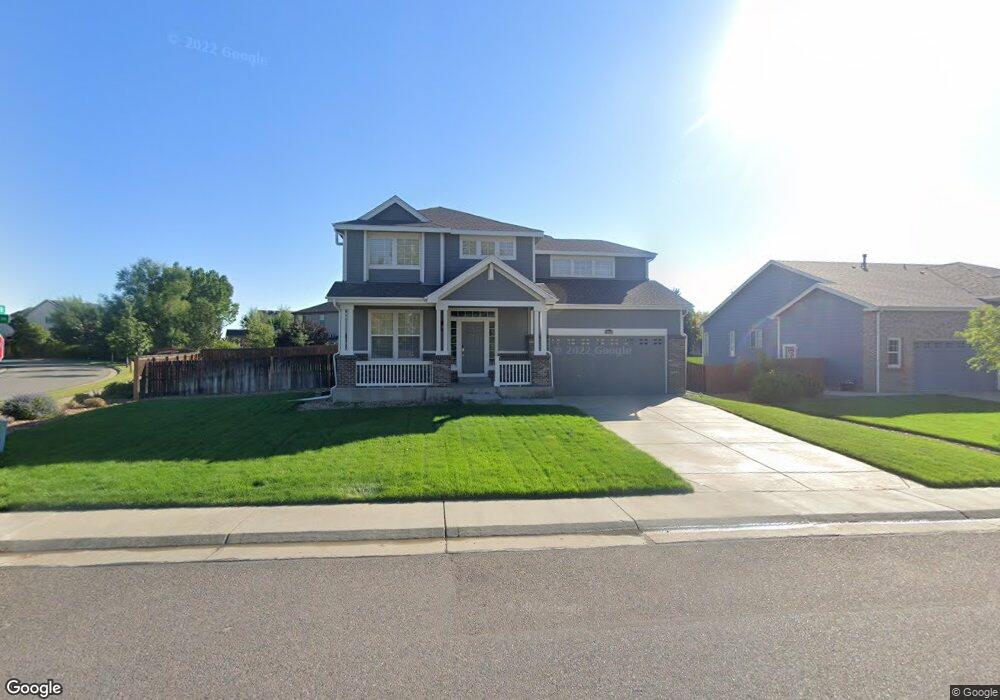
12503 Locust Way Thornton, CO 80602
Estimated Value: $640,455 - $682,000
3
Beds
3
Baths
4,417
Sq Ft
$150/Sq Ft
Est. Value
About This Home
This home is located at 12503 Locust Way, Thornton, CO 80602 and is currently estimated at $661,364, approximately $149 per square foot. 12503 Locust Way is a home located in Adams County with nearby schools including West Ridge Elementary School, Shore Acres Elementary School, and Elderberry Elementary.
Ownership History
Date
Name
Owned For
Owner Type
Purchase Details
Closed on
Jun 24, 2019
Sold by
Dover Joanna Y and Kim Joanna Y
Bought by
Landavazo Timothy
Current Estimated Value
Home Financials for this Owner
Home Financials are based on the most recent Mortgage that was taken out on this home.
Original Mortgage
$468,868
Outstanding Balance
$412,250
Interest Rate
4.1%
Mortgage Type
VA
Estimated Equity
$249,114
Purchase Details
Closed on
Jun 22, 2012
Sold by
Kim Joanna Y
Bought by
Dover Joanna Y and Kim Joanna Y
Home Financials for this Owner
Home Financials are based on the most recent Mortgage that was taken out on this home.
Original Mortgage
$223,930
Interest Rate
3.81%
Mortgage Type
New Conventional
Purchase Details
Closed on
Mar 8, 2006
Sold by
Centex Homes
Bought by
Kim Joanna Y
Home Financials for this Owner
Home Financials are based on the most recent Mortgage that was taken out on this home.
Original Mortgage
$175,777
Interest Rate
6.09%
Mortgage Type
Fannie Mae Freddie Mac
Create a Home Valuation Report for This Property
The Home Valuation Report is an in-depth analysis detailing your home's value as well as a comparison with similar homes in the area
Home Values in the Area
Average Home Value in this Area
Purchase History
| Date | Buyer | Sale Price | Title Company |
|---|---|---|---|
| Landavazo Timothy | $459,000 | Chicago Title | |
| Dover Joanna Y | -- | First American | |
| Kim Joanna Y | $275,777 | Commerce Title |
Source: Public Records
Mortgage History
| Date | Status | Borrower | Loan Amount |
|---|---|---|---|
| Open | Landavazo Timothy | $468,868 | |
| Previous Owner | Dover Joanna Y | $223,930 | |
| Previous Owner | Kim Joanna Y | $175,777 |
Source: Public Records
Tax History Compared to Growth
Tax History
| Year | Tax Paid | Tax Assessment Tax Assessment Total Assessment is a certain percentage of the fair market value that is determined by local assessors to be the total taxable value of land and additions on the property. | Land | Improvement |
|---|---|---|---|---|
| 2024 | $4,235 | $41,880 | $7,940 | $33,940 |
| 2023 | $4,214 | $47,150 | $7,100 | $40,050 |
| 2022 | $3,177 | $32,390 | $7,300 | $25,090 |
| 2021 | $3,060 | $32,390 | $7,300 | $25,090 |
| 2020 | $3,009 | $33,240 | $7,510 | $25,730 |
| 2019 | $3,012 | $33,240 | $7,510 | $25,730 |
| 2018 | $2,833 | $31,250 | $6,840 | $24,410 |
| 2017 | $2,829 | $31,250 | $6,840 | $24,410 |
| 2016 | $2,477 | $27,260 | $4,620 | $22,640 |
| 2015 | $2,471 | $27,260 | $4,620 | $22,640 |
| 2014 | $2,132 | $23,890 | $3,780 | $20,110 |
Source: Public Records
Map
Nearby Homes
- 12682 Kearney St
- 12609 Jersey Cir W
- 12388 Jasmine St
- 12778 Jasmine St Unit E
- 12450 Kearney Cir
- 12740 Jasmine St Unit F
- 6659 Monaco Way
- 12733 Leyden St Unit C
- 6712 E 123rd Cir
- 12774 Leyden St Unit D
- 12754 Leyden St Unit E
- 12774 Jasmine Ct
- 5757 E 122nd Dr
- 6264 E 122nd Ave
- 12771 Jasmine Ct
- 12260 Magnolia Way
- 12554 Hudson Ct
- 12741 Ivanhoe St
- 5913 E 121st Place
- 6358 E 121st Place
- 12513 Locust Way
- 6303 E 126th Place
- 6302 E 126th Place
- 12523 Locust Way
- 12569 Locust Place
- 12533 Locust Way
- 6313 E 126th Place
- 6312 E 126th Place
- 12634 Jersey Cir E
- 12638 Jersey Cir E
- 12509 Locust Place
- 12559 Locust Place
- 12642 Jersey Cir E
- 12630 Jersey Cir E
- 12543 Locust Way
- 6323 E 126th Place
- 12646 Jersey Cir E
- 6322 E 126th Place
- 6304 E 127th Place
- 12519 Locust Place