Estimated Value: $294,000 - $341,000
3
Beds
2
Baths
1,302
Sq Ft
$245/Sq Ft
Est. Value
About This Home
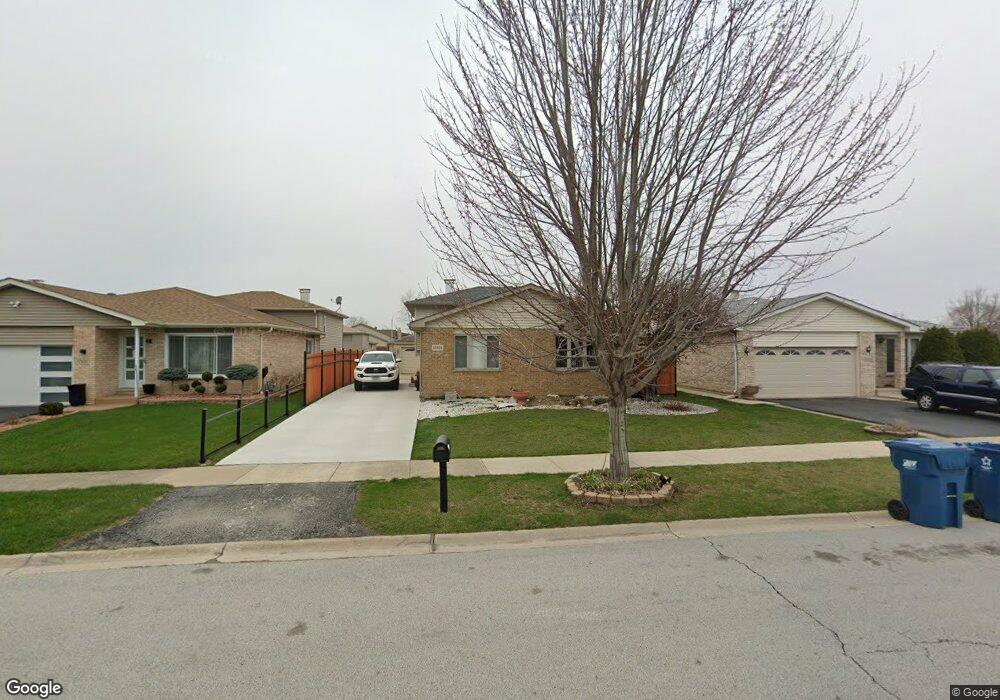
This home is located at 12504 S Quinn Dr, Alsip, IL 60803 and is currently estimated at $318,883, approximately $244 per square foot. 12504 S Quinn Dr is a home located in Cook County with nearby schools including George Washington Elementary School, Nathan Hale Middle School, and Dwight D. Eisenhower High School.
Ownership History
Date
Name
Owned For
Owner Type
Purchase Details
Closed on
Jul 28, 2003
Sold by
Williamson Lee E and Williamson Reginia
Bought by
Ochoa Juan and Ochoa Isabel
Current Estimated Value
Home Financials for this Owner
Home Financials are based on the most recent Mortgage that was taken out on this home.
Original Mortgage
$185,000
Interest Rate
5.37%
Mortgage Type
Purchase Money Mortgage
Purchase Details
Closed on
May 20, 1999
Sold by
Standard Bank & Trust Company
Bought by
Williams Lee E and Williamson Reginia
Home Financials for this Owner
Home Financials are based on the most recent Mortgage that was taken out on this home.
Original Mortgage
$117,600
Interest Rate
6.92%
Purchase Details
Closed on
Mar 19, 1997
Sold by
Standard Bank & Trust Company
Bought by
Standard Bank & Trust Company and Trust #10483
Create a Home Valuation Report for This Property
The Home Valuation Report is an in-depth analysis detailing your home's value as well as a comparison with similar homes in the area
Home Values in the Area
Average Home Value in this Area
Purchase History
| Date | Buyer | Sale Price | Title Company |
|---|---|---|---|
| Ochoa Juan | $195,000 | Multiple | |
| Williams Lee E | $147,000 | -- | |
| Standard Bank & Trust Company | $22,000 | -- |
Source: Public Records
Mortgage History
| Date | Status | Borrower | Loan Amount |
|---|---|---|---|
| Previous Owner | Ochoa Juan | $185,000 | |
| Previous Owner | Williams Lee E | $117,600 |
Source: Public Records
Tax History Compared to Growth
Tax History
| Year | Tax Paid | Tax Assessment Tax Assessment Total Assessment is a certain percentage of the fair market value that is determined by local assessors to be the total taxable value of land and additions on the property. | Land | Improvement |
|---|---|---|---|---|
| 2024 | $7,793 | $25,001 | $3,438 | $21,563 |
| 2023 | $6,462 | $25,001 | $3,438 | $21,563 |
| 2022 | $6,462 | $18,274 | $2,969 | $15,305 |
| 2021 | $6,185 | $18,273 | $2,968 | $15,305 |
| 2020 | $6,133 | $18,273 | $2,968 | $15,305 |
| 2019 | $5,827 | $17,414 | $2,656 | $14,758 |
| 2018 | $6,369 | $19,306 | $2,656 | $16,650 |
| 2017 | $6,517 | $19,306 | $2,656 | $16,650 |
| 2016 | $5,293 | $15,207 | $2,187 | $13,020 |
| 2015 | $5,138 | $15,207 | $2,187 | $13,020 |
| 2014 | $5,939 | $17,546 | $2,187 | $15,359 |
| 2013 | $5,969 | $19,063 | $2,187 | $16,876 |
Source: Public Records
Map
Nearby Homes
- 12539 S Quinn Dr Unit 402
- 3729 W Glen Dr Unit 804
- 3823 W 123rd St Unit 302
- 3821 W 123rd St Unit 301
- 12521 S Central Park Ave Unit 1
- 3909 W 123rd St Unit 205A
- 12416 S Trumbull Ave
- 12211 S Harding Ave
- 3416 W 124th St
- 3609 W 121st St
- 3754 W 120th St Unit 2D
- 12507 S Tripp Ave
- 4326 W Emerald Way St
- 4336 W Emerald Way St
- 4343 W Emerald Way St
- 11809 S Millard Ave
- 4406 W 127th Place
- 11750 S Homan Ave Unit J
- 12026 S Kildare Ave Unit 16
- 11800 S Komensky Ave Unit 203
- 12500 S Quinn Dr
- 12512 S Quinn Dr
- 12516 S Quinn Dr
- 12501 S Quinn Dr Unit 101
- 12505 S Quinn Dr Unit 104
- 12511 S Arbor Dr
- 12507 S Arbor Dr
- 12507 S Arbor Dr
- 12515 S Arbor Dr
- 12520 S Quinn Dr
- 12505 S Arbor Dr
- 12503 S Quinn Dr Unit 102
- 12519 S Arbor Dr
- 12507 S Quinn Dr Unit 103
- 12513 S Quinn Dr Unit 201
- 12501 S Arbor Dr
- 12517 S Quinn Dr Unit 204
- 12524 S Quinn Dr
- 12515 S Quinn Dr Unit 202
- 12521 S Arbor Dr