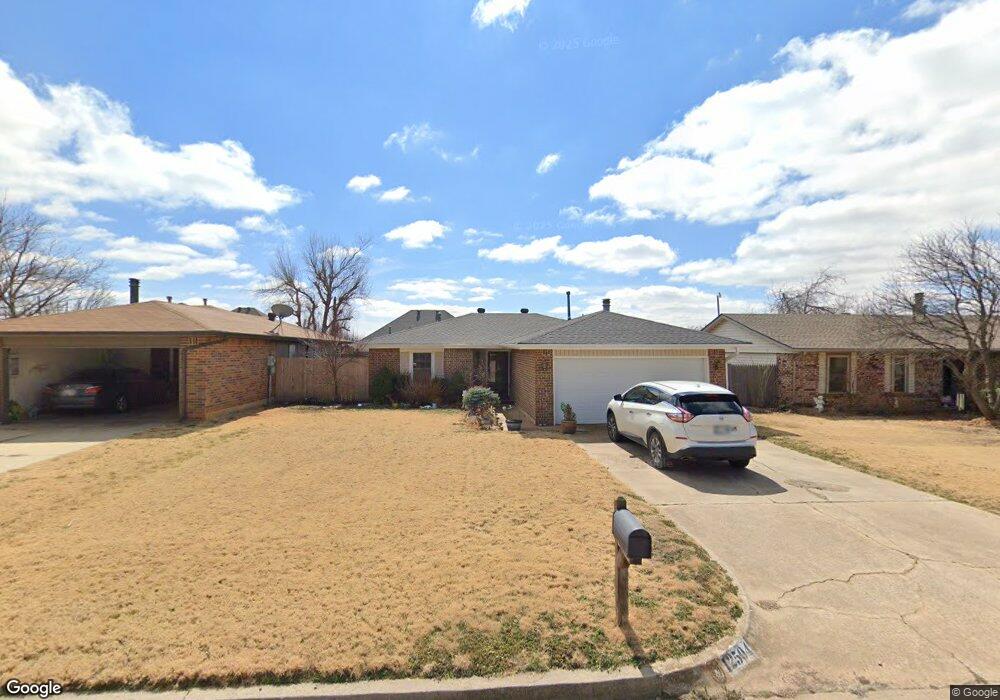
12504 SW 6th St Yukon, OK 73099
Westgate NeighborhoodEstimated Value: $165,000 - $178,000
2
Beds
1
Bath
1,093
Sq Ft
$158/Sq Ft
Est. Value
About This Home
This home is located at 12504 SW 6th St, Yukon, OK 73099 and is currently estimated at $172,670, approximately $157 per square foot. 12504 SW 6th St is a home located in Canadian County with nearby schools including Mustang Trails Elementary School, Meadow Brook Intermediate School, and Mustang Central Middle School.
Ownership History
Date
Name
Owned For
Owner Type
Purchase Details
Closed on
Sep 2, 2009
Sold by
Myers Belding Keli D and Belding Thomas R
Bought by
Arthur Ann M
Current Estimated Value
Home Financials for this Owner
Home Financials are based on the most recent Mortgage that was taken out on this home.
Original Mortgage
$83,460
Outstanding Balance
$54,610
Interest Rate
5.2%
Estimated Equity
$118,060
Purchase Details
Closed on
Sep 28, 2004
Sold by
Pendleton Ryan M and Pendleton Amie M
Home Financials for this Owner
Home Financials are based on the most recent Mortgage that was taken out on this home.
Original Mortgage
$71,931
Interest Rate
5.81%
Purchase Details
Closed on
Oct 1, 1997
Sold by
Chavez Brian K
Purchase Details
Closed on
Aug 15, 1997
Sold by
Minnick Daniel A
Purchase Details
Closed on
Jul 16, 1993
Sold by
Tullos Walter V and Tullos Eugenia W
Purchase Details
Closed on
Sep 26, 1989
Purchase Details
Closed on
Aug 23, 1989
Purchase Details
Closed on
Nov 19, 1987
Create a Home Valuation Report for This Property
The Home Valuation Report is an in-depth analysis detailing your home's value as well as a comparison with similar homes in the area
Home Values in the Area
Average Home Value in this Area
Purchase History
| Date | Buyer | Sale Price | Title Company |
|---|---|---|---|
| Arthur Ann M | $85,000 | None Available | |
| -- | $72,500 | -- | |
| -- | -- | -- | |
| -- | $55,000 | -- | |
| -- | $55,000 | -- | |
| -- | $38,500 | -- | |
| -- | -- | -- | |
| -- | -- | -- | |
| -- | -- | -- |
Source: Public Records
Mortgage History
| Date | Status | Borrower | Loan Amount |
|---|---|---|---|
| Open | Arthur Ann M | $83,460 | |
| Previous Owner | -- | $71,931 |
Source: Public Records
Tax History Compared to Growth
Tax History
| Year | Tax Paid | Tax Assessment Tax Assessment Total Assessment is a certain percentage of the fair market value that is determined by local assessors to be the total taxable value of land and additions on the property. | Land | Improvement |
|---|---|---|---|---|
| 2024 | $1,399 | $13,755 | $1,440 | $12,315 |
| 2023 | $1,399 | $13,354 | $1,440 | $11,914 |
| 2022 | $1,375 | $12,965 | $1,440 | $11,525 |
| 2021 | $1,327 | $12,588 | $1,440 | $11,148 |
| 2020 | $1,298 | $12,221 | $1,440 | $10,781 |
| 2019 | $1,256 | $11,865 | $1,440 | $10,425 |
| 2018 | $1,238 | $11,520 | $1,440 | $10,080 |
| 2017 | $1,183 | $11,184 | $1,440 | $9,744 |
| 2016 | $1,142 | $11,050 | $1,440 | $9,610 |
| 2015 | $1,132 | $10,542 | $1,440 | $9,102 |
| 2014 | $1,132 | $10,692 | $1,440 | $9,252 |
Source: Public Records
Map
Nearby Homes
- 12401 SW 7th St
- 12824 NW 4th Terrace
- 517 Cherokee Gate Dr
- 501 S Greengate Dr
- 521 Apache Gate Dr
- 12325 SW 6th St
- 12400 Newgate Dr
- 12616 NW 1st Terrace
- 12712 NW 1st Ct
- 904 Norway Ave
- 13 Evermore Ln
- 12127 SW 4th St
- 418 Palo Verde Dr
- 24 Carat Dr
- 701 Cassandra Ln
- 311 Tumbleweed Rd
- 1025 Switzerland Ave
- 101 Carat Dr
- Indalo Plan at The Springs at Skyline Trails
- Kirkland Plan at The Springs at Skyline Trails
- 12508 SW 6th St
- 12424 SW 6th St
- 12512 SW 6th St
- 12513 SW 7th St
- 12420 SW 6th St
- 12509 SW 6th St
- 12505 SW 7th St
- 12505 SW 6th St
- 12513 SW 6th St
- 12421 SW 6th St
- 12416 SW 6th St
- 12501 SW 7th St
- 12517 SW 6th St
- 12417 SW 6th St
- 705 S Greengate Dr
- 12412 SW 6th St
- 701 S Greengate Dr
- 12504 SW 5th St
- 12413 SW 7th St
- 12413 SW 6th St