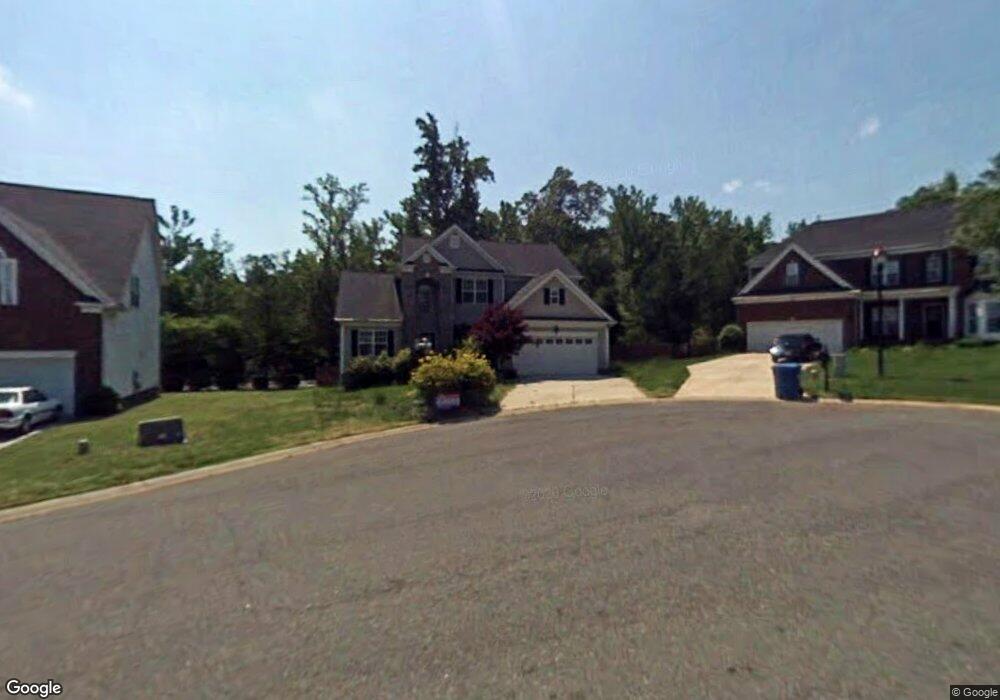
12505 Stirling Trace Ct Charlotte, NC 28277
Estimated Value: $611,000 - $682,000
5
Beds
3
Baths
2,533
Sq Ft
$252/Sq Ft
Est. Value
About This Home
This home is located at 12505 Stirling Trace Ct, Charlotte, NC 28277 and is currently estimated at $638,533, approximately $252 per square foot. 12505 Stirling Trace Ct is a home located in Mecklenburg County with nearby schools including Ballantyne Elementary, Community House Middle School, and Ardrey Kell High.
Ownership History
Date
Name
Owned For
Owner Type
Purchase Details
Closed on
Aug 13, 2009
Sold by
Diaz Perera Raul and Diaz Perera Sahyly
Bought by
Diaz Perera Sahyly
Current Estimated Value
Purchase Details
Closed on
Aug 4, 2005
Sold by
Vitti Michael S and Vitti Alison R
Bought by
Diaz Perera Raul M and Diaz Perera Sahyly M
Purchase Details
Closed on
May 7, 2003
Sold by
Odom Lester J
Bought by
Vitti Michael S and Vitti Alison R
Home Financials for this Owner
Home Financials are based on the most recent Mortgage that was taken out on this home.
Original Mortgage
$165,600
Interest Rate
5.25%
Mortgage Type
Purchase Money Mortgage
Purchase Details
Closed on
Jun 27, 2001
Sold by
Shea Homes Llc
Bought by
Odom Lester J
Home Financials for this Owner
Home Financials are based on the most recent Mortgage that was taken out on this home.
Original Mortgage
$192,550
Interest Rate
7.14%
Create a Home Valuation Report for This Property
The Home Valuation Report is an in-depth analysis detailing your home's value as well as a comparison with similar homes in the area
Home Values in the Area
Average Home Value in this Area
Purchase History
| Date | Buyer | Sale Price | Title Company |
|---|---|---|---|
| Diaz Perera Sahyly | -- | None Available | |
| Diaz Perera Raul M | $219,000 | -- | |
| Vitti Michael S | $207,000 | -- | |
| Odom Lester J | $214,000 | -- |
Source: Public Records
Mortgage History
| Date | Status | Borrower | Loan Amount |
|---|---|---|---|
| Previous Owner | Vitti Michael S | $165,600 | |
| Previous Owner | Odom Lester J | $192,550 | |
| Closed | Vitti Michael S | $41,400 |
Source: Public Records
Tax History Compared to Growth
Tax History
| Year | Tax Paid | Tax Assessment Tax Assessment Total Assessment is a certain percentage of the fair market value that is determined by local assessors to be the total taxable value of land and additions on the property. | Land | Improvement |
|---|---|---|---|---|
| 2025 | $3,464 | $495,400 | $120,000 | $375,400 |
| 2024 | $3,464 | $495,400 | $120,000 | $375,400 |
| 2023 | $3,409 | $495,400 | $120,000 | $375,400 |
| 2022 | $2,820 | $315,200 | $80,000 | $235,200 |
| 2021 | $2,752 | $315,200 | $80,000 | $235,200 |
| 2020 | $2,736 | $315,200 | $80,000 | $235,200 |
| 2019 | $2,704 | $334,700 | $80,000 | $254,700 |
| 2018 | $2,631 | $232,900 | $57,000 | $175,900 |
| 2017 | $2,610 | $232,900 | $57,000 | $175,900 |
| 2016 | $2,576 | $232,900 | $57,000 | $175,900 |
| 2015 | $2,549 | $232,900 | $57,000 | $175,900 |
| 2014 | $2,506 | $231,400 | $57,000 | $174,400 |
Source: Public Records
Map
Nearby Homes
- 12533 Bluestem Ln
- 8310 Sandstone Crest Ln
- 6858 Hunts Mesa Dr
- 15310 Brynfield Dr
- 14902 Bridle Trace Ln
- 2277 Idol Rock Dr
- 15224 Barossa Valley St Unit 762B
- 12421 Fiorentina St
- 8420 Golden Stone Ln
- 15208 Loire Valley St Unit 1A
- 15209 Loire Valley St Unit 1A
- 14604 Monferrato Way Unit 791A
- 6059 Ancestry Trail
- 4650 Monument Valley Dr
- 14521 Crociani Dr
- 10935 Harrisburg Rd
- 12008 Bordeaux St Unit 112A
- 11002 Harrisburg Rd
- 6110 Ancestry Trail Unit 46
- 10751 Ola Dr
- 12501 Stirling Trace Ct
- 12509 Stirling Trace Ct
- 12512 Stirling Trace Ct
- 12502 Stirling Trace Ct
- 12529 Providence Rd W
- 12447 Stirling Trace Ct
- 12444 Stirling Trace Ct
- 15106 Glenfinnan Dr
- 12441 Stirling Trace Ct
- 12436 Stirling Trace Ct
- 15103 Glenfinnan Dr
- 15103 Glenfinnan Dr Unit 20
- 15102 Glenfinnan Dr
- 12437 Stirling Trace Ct
- 10942 Barberville Rd
- 12428 Stirling Trace Ct
- 15039 Glenfinnan Dr
- 12419 Providence Rd W
- 12431 Stirling Trace Ct
- 15040 Glenfinnan Dr