Estimated payment $2,135/month
Highlights
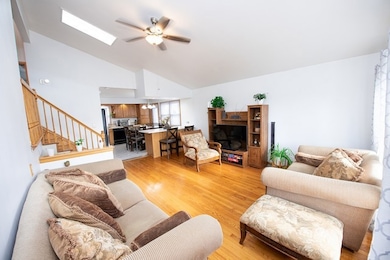
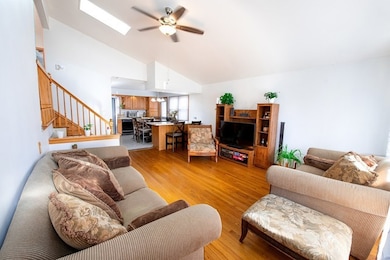
- Open Floorplan
- Property is near a park
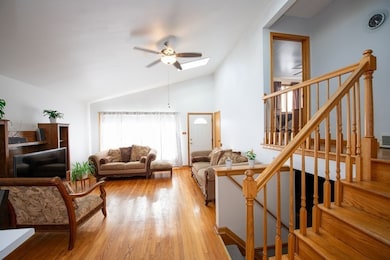
- Skylights
- Contemporary Architecture
- Wood Flooring
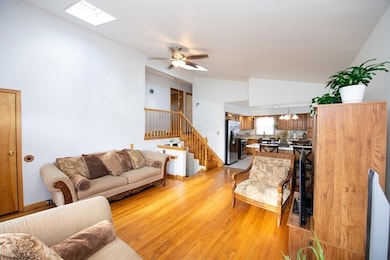
- Living Room
About This Home
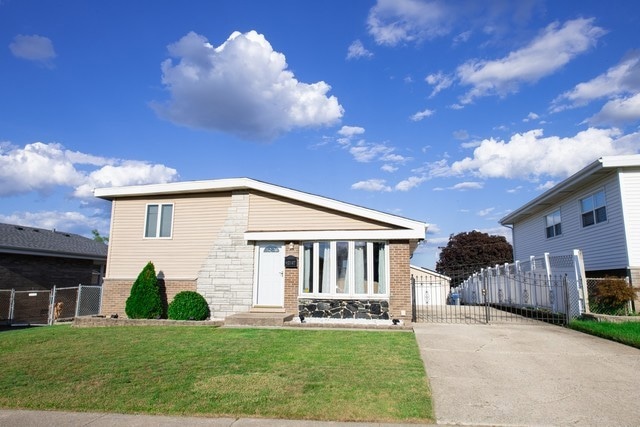
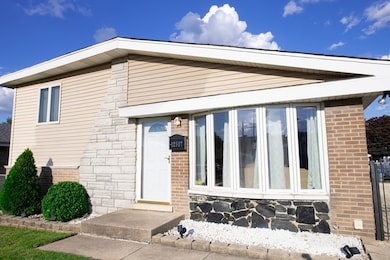
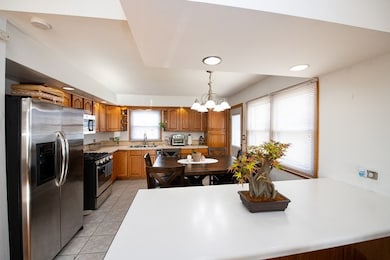
This charming brick split-level in Alsip has so much to offer! Step inside to a welcoming living room with a skylight and hardwood floors, flowing seamlessly into a stylish kitchen with canned lighting, generous cabinet space, and an island-perfect for entertaining. The home includes 3 bedrooms with ample closets, 2 bathrooms, and a comfortable lower-level family room. You'll love the convenience of a separate laundry room, side drive with 2-car garage, and a large backyard ideal for gatherings, relaxing, or play. Plus, enjoy the benefit of professional solar panels to help save on electricity! Electric Comed approximately $20.00 a month. With a newer roof and thoughtful updates throughout, this home is move-in ready and well cared for.
Listing Agent
Illinois Real Estate Partners Inc License #475171184 Listed on: 10/09/2025

Home Details
Home Type
- Single Family
Est. Annual Taxes
- $7,290
Year Built
- Built in 1967
Parking
- 2 Car Garage
- Driveway
- Parking Included in Price
Home Design
- Contemporary Architecture
- Split Level Home
- Brick Exterior Construction
- Stone Siding
Interior Spaces
- 1,257 Sq Ft Home
- Open Floorplan
- Ceiling Fan
- Skylights
- Family Room
- Living Room
- Dining Room
Kitchen
- Range
- Microwave
- Dishwasher
Flooring
- Wood
- Carpet
Bedrooms and Bathrooms
- 3 Bedrooms
- 3 Potential Bedrooms
- 2 Full Bathrooms
Laundry
- Laundry Room
- Sink Near Laundry
Basement
- Basement Fills Entire Space Under The House
- Finished Basement Bathroom
Utilities
- Central Air
- Heating System Uses Natural Gas
- Lake Michigan Water
Additional Features
- Paved or Partially Paved Lot
- Property is near a park
Map
Home Values in the Area
Average Home Value in this Area
Tax History
| Year | Tax Paid | Tax Assessment Tax Assessment Total Assessment is a certain percentage of the fair market value that is determined by local assessors to be the total taxable value of land and additions on the property. | Land | Improvement |
|---|---|---|---|---|
| 2024 | $7,290 | $22,000 | $3,685 | $18,315 |
| 2023 | $5,404 | $22,000 | $3,685 | $18,315 |
| 2022 | $5,404 | $13,456 | $3,183 | $10,273 |
| 2021 | $3,868 | $13,455 | $3,182 | $10,273 |
| 2020 | $4,432 | $14,839 | $3,182 | $11,657 |
| 2019 | $2,613 | $10,100 | $2,847 | $7,253 |
| 2018 | $2,513 | $10,100 | $2,847 | $7,253 |
| 2017 | $3,321 | $12,120 | $2,847 | $9,273 |
| 2016 | $3,411 | $11,296 | $2,345 | $8,951 |
| 2015 | $3,721 | $12,298 | $2,345 | $9,953 |
| 2014 | $3,613 | $12,298 | $2,345 | $9,953 |
| 2013 | $2,903 | $11,084 | $2,345 | $8,739 |
Property History
| Date | Event | Price | List to Sale | Price per Sq Ft |
|---|---|---|---|---|
| 10/09/2025 10/09/25 | For Sale | $290,000 | -- | $231 / Sq Ft |
Purchase History
| Date | Type | Sale Price | Title Company |
|---|---|---|---|
| Warranty Deed | $160,000 | Alliance Title Corporation | |
| Warranty Deed | $210,000 | Ticor Title | |
| Warranty Deed | -- | -- |
Mortgage History
| Date | Status | Loan Amount | Loan Type |
|---|---|---|---|
| Open | $157,102 | FHA | |
| Previous Owner | $120,000 | Unknown | |
| Previous Owner | $129,908 | FHA |
Source: Midwest Real Estate Data (MRED)
MLS Number: 12492235
APN: 24-27-403-030-0000
Disclaimer: Certain information contained herein is derived from information provided by parties other than Homes.com. All information provided is deemed reliable, but is not guaranteed to be accurate and should be independently verified.
![]() Based on information submitted to the MLS GRID. All data is obtained from various sources and may not have been verified by broker or MLS GRID. Supplied Open House Information is subject to change without notice. All information should be independently reviewed and verified for accuracy. Properties may or may not be listed by the office/agent presenting the information. Some IDX listings have been excluded from this website.
Based on information submitted to the MLS GRID. All data is obtained from various sources and may not have been verified by broker or MLS GRID. Supplied Open House Information is subject to change without notice. All information should be independently reviewed and verified for accuracy. Properties may or may not be listed by the office/agent presenting the information. Some IDX listings have been excluded from this website.
The Digital Millennium Copyright Act of 1998, 17 U.S.C. § 512 (the “DMCA”) provides recourse for copyright owners who believe that material appearing on the Internet infringes their rights under U.S. copyright law. If you believe in good faith that any content or material made available in connection with our website or services infringes your copyright, you (or your agent) may send us a notice requesting that the content or material be removed, or access to it blocked.
Notices must be sent in writing by email to DMCAnotice@MLSGrid.com.
The DMCA requires that your notice of alleged copyright infringement include the following information:
(1) description of the copyrighted work that is the subject of claimed infringement;
(2) description of the alleged infringing content and information sufficient to permit us to locate the content;
(3) contact information for you, including your address, telephone number and email address;
(4) a statement by you that you have a good faith belief that the content in the manner complained of is not authorized by the copyright owner, or its agent, or by the operation of any law;
(5) a statement by you, signed under penalty of perjury, that the information in the notification is accurate and that you have the authority to enforce the copyrights that are claimed to be infringed; and
(6) a physical or electronic signature of the copyright owner or a person authorized to act on the copyright owner’s behalf. Failure to include all of the above information may result in the delay of the processing of your complaint.
- 4309 W Park Lane Dr Unit 2B
- 4326 W Emerald Way St
- 4336 W Emerald Way St
- 4343 W Emerald Way St
- 4406 W 127th Place
- 12736 S Kenneth Ave Unit 1A
- 12738 S Kenneth Ave Unit E
- 12824 S Kenneth Ave Unit F1
- 3909 W 123rd St Unit 205A
- 12211 S Harding Ave
- 3823 W 123rd St Unit 302
- 3821 W 123rd St Unit 301
- 12026 S Kildare Ave Unit 16
- 3729 W Glen Dr Unit 804
- 12730 S Mcdaniels St
- 4804 W 118th St
- 4808 W 118th St
- 3639 W Scott Dr
- 4735 W 122nd St
- 12147 S Cicero Ave
- 12549 S Tripp Ave
- 3913 W 124th Place Unit 3w
- 12255 S Mcdaniels St Unit GN
- 4622 W 122nd St
- 12715 S La Crosse Ave Unit 104
- 11840 S Karlov Ave Unit BE
- 11937 S Hamlin Ave Unit 3C
- 3621 W 119th St
- 11600 S Kilbourn Ave
- 12814 E Playfield Dr
- 12800 Terrace Ln Unit ID1330089P
- 4050-4064 W 115th St
- 12804 W Playfield Dr Unit ID1330088P
- 10533 Parkside Ave Unit 2
- 10533 Parkside Ave Unit 2E
- 12500 Fairview Ave
- 12548 Fairview Ave Unit 2B
- 5723 129th St Unit 7F
- 12613 Maple Ave Unit 1
- 2823 Broadway St