Estimated Value: $267,734 - $297,000
3
Beds
1
Bath
1,135
Sq Ft
$248/Sq Ft
Est. Value
About This Home
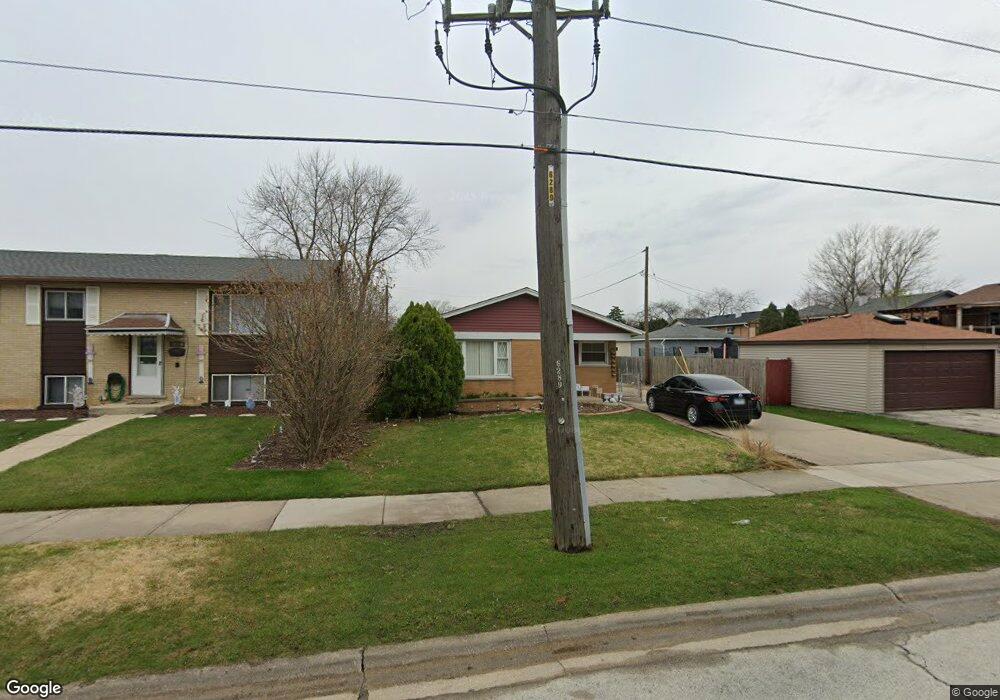
This home is located at 12512 S Homan Ave, Alsip, IL 60803 and is currently estimated at $281,578, approximately $248 per square foot. 12512 S Homan Ave is a home located in Cook County with nearby schools including George Washington Elementary School, Nathan Hale Middle School, and Dwight D. Eisenhower High School.
Ownership History
Date
Name
Owned For
Owner Type
Purchase Details
Closed on
Aug 30, 2022
Sold by
Gallegos Salvador and Lopez Nancy E
Bought by
Lopez Nancy E
Current Estimated Value
Purchase Details
Closed on
Jul 26, 2003
Sold by
Klingensmith Roger N and Klingensmith Laura J
Bought by
Gallegos Salvador and Lopez Nancy E
Home Financials for this Owner
Home Financials are based on the most recent Mortgage that was taken out on this home.
Original Mortgage
$144,728
Interest Rate
6.23%
Mortgage Type
FHA
Purchase Details
Closed on
Oct 31, 1994
Sold by
Zenner Joseph F and Zenner Veronica L
Bought by
Klingensmith Roger N and Klingensmith Laura J
Home Financials for this Owner
Home Financials are based on the most recent Mortgage that was taken out on this home.
Original Mortgage
$106,150
Interest Rate
8.86%
Mortgage Type
FHA
Create a Home Valuation Report for This Property
The Home Valuation Report is an in-depth analysis detailing your home's value as well as a comparison with similar homes in the area
Home Values in the Area
Average Home Value in this Area
Purchase History
| Date | Buyer | Sale Price | Title Company |
|---|---|---|---|
| Lopez Nancy E | -- | None Listed On Document | |
| Gallegos Salvador | $147,000 | Chicago Title Insurance Comp | |
| Klingensmith Roger N | $107,000 | Attorneys Natl Title Network |
Source: Public Records
Mortgage History
| Date | Status | Borrower | Loan Amount |
|---|---|---|---|
| Previous Owner | Gallegos Salvador | $144,728 | |
| Previous Owner | Klingensmith Roger N | $106,150 |
Source: Public Records
Tax History Compared to Growth
Tax History
| Year | Tax Paid | Tax Assessment Tax Assessment Total Assessment is a certain percentage of the fair market value that is determined by local assessors to be the total taxable value of land and additions on the property. | Land | Improvement |
|---|---|---|---|---|
| 2024 | $5,996 | $20,000 | $3,450 | $16,550 |
| 2023 | $3,936 | $20,000 | $3,450 | $16,550 |
| 2022 | $3,936 | $12,467 | $3,000 | $9,467 |
| 2021 | $3,782 | $12,467 | $3,000 | $9,467 |
| 2020 | $3,786 | $12,467 | $3,000 | $9,467 |
| 2019 | $5,032 | $15,505 | $2,700 | $12,805 |
| 2018 | $4,844 | $15,505 | $2,700 | $12,805 |
| 2017 | $4,962 | $15,505 | $2,700 | $12,805 |
| 2016 | $4,576 | $13,486 | $2,250 | $11,236 |
| 2015 | $4,435 | $13,486 | $2,250 | $11,236 |
| 2014 | $4,329 | $13,486 | $2,250 | $11,236 |
| 2013 | $4,612 | $15,326 | $2,250 | $13,076 |
Source: Public Records
Map
Nearby Homes
- 3404 W 125th St
- 12416 S Trumbull Ave
- 3416 W 124th St
- 12521 S Central Park Ave Unit 1
- 3639 W Scott Dr
- 3729 W Glen Dr Unit 804
- 3609 W 121st St
- 3823 W 123rd St Unit 302
- 3909 W 123rd St Unit 205A
- 11953 S Lawndale Ave Unit 5B2
- 11750 S Homan Ave Unit J
- 11750 S Homan Ave Unit 98
- 11915 S Lawndale Ave Unit 2C4
- 12456 Fairview Ave
- 12452 Fairview Ave
- 3754 W 120th St Unit 2D
- 12544 Fairview Ave Unit 2G
- 12546 Fairview Ave Unit 3D
- 12548 Fairview Ave Unit BLDG1
- 12558 Fairview Ave Unit 1B
- 12516 S Homan Ave
- 3405 W 125th St
- 3401 W 125th St
- 12520 S Homan Ave
- 3409 W 125th St
- 12525 S Trumbull Ave
- 12527 S Trumbull Ave
- 12524 S Homan Ave
- 3413 W 125th St
- 3417 W 125th St
- 12528 S Homan Ave
- 12529 S Trumbull Ave Unit 133
- 3421 W 125th St
- 12523 S Trumbull Ave
- 12532 S Homan Ave
- 3400 W 125th St
- 3408 W 125th St
- 3425 W 125th St
- 12535 S Trumbull Ave
- 3412 W 125th St