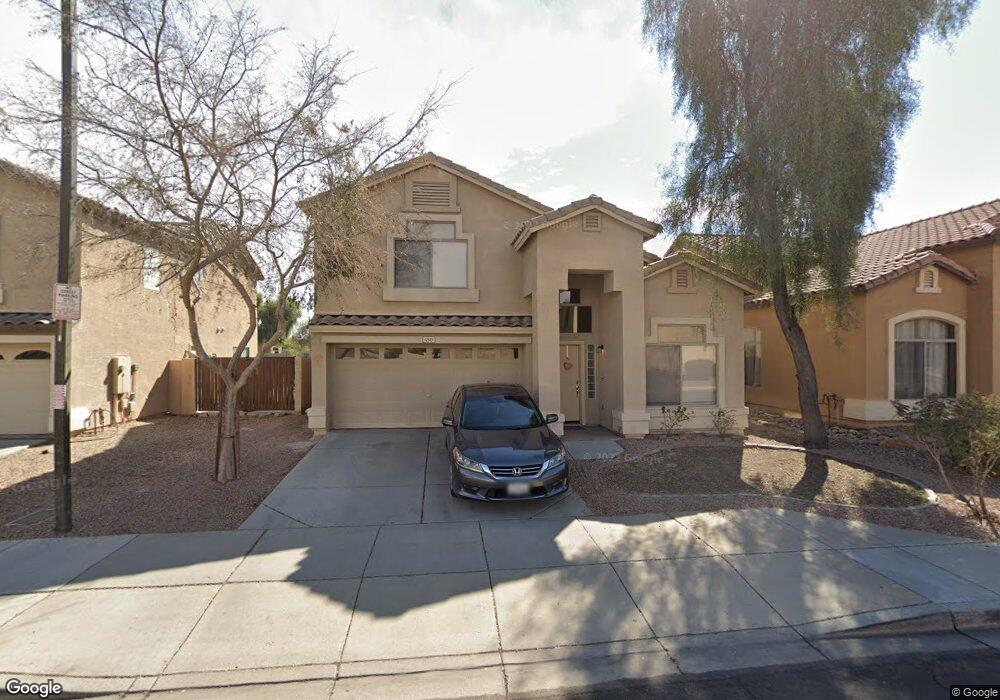
12513 W Medlock Dr Litchfield Park, AZ 85340
Estimated Value: $350,869 - $421,000
--
Bed
3
Baths
2,024
Sq Ft
$194/Sq Ft
Est. Value
About This Home
This home is located at 12513 W Medlock Dr, Litchfield Park, AZ 85340 and is currently estimated at $391,717, approximately $193 per square foot. 12513 W Medlock Dr is a home located in Maricopa County with nearby schools including Barbara B. Robey Elementary School, L. Thomas Heck Middle School, and Crown Charter School.
Ownership History
Date
Name
Owned For
Owner Type
Purchase Details
Closed on
Jun 3, 2021
Sold by
Buma Brian and Lackie Mary Lynn
Bought by
Progress Phoenix Llc
Current Estimated Value
Purchase Details
Closed on
Jan 15, 2010
Sold by
Land Asset Protection Llc
Bought by
Buma Brian and Lackie Mary Lynn
Purchase Details
Closed on
Oct 5, 2009
Sold by
Wydronek Marcus
Bought by
Land Asset Protection Llc
Purchase Details
Closed on
Nov 12, 2003
Sold by
Wydronek Mandy
Bought by
Wydronek Marcus
Home Financials for this Owner
Home Financials are based on the most recent Mortgage that was taken out on this home.
Original Mortgage
$157,219
Interest Rate
5.89%
Mortgage Type
Purchase Money Mortgage
Create a Home Valuation Report for This Property
The Home Valuation Report is an in-depth analysis detailing your home's value as well as a comparison with similar homes in the area
Home Values in the Area
Average Home Value in this Area
Purchase History
| Date | Buyer | Sale Price | Title Company |
|---|---|---|---|
| Progress Phoenix Llc | $322,500 | Magnus Title Agency | |
| Buma Brian | $118,000 | Empire West Title Agency | |
| Land Asset Protection Llc | $84,000 | None Available | |
| Wydronek Marcus | -- | Century Title Agency Inc | |
| Wydronek Marcus | $159,680 | Century Title Agency Inc | |
| Continental Homes Inc | -- | Century Title Agency Inc |
Source: Public Records
Mortgage History
| Date | Status | Borrower | Loan Amount |
|---|---|---|---|
| Previous Owner | Continental Homes Inc | $157,219 |
Source: Public Records
Tax History Compared to Growth
Tax History
| Year | Tax Paid | Tax Assessment Tax Assessment Total Assessment is a certain percentage of the fair market value that is determined by local assessors to be the total taxable value of land and additions on the property. | Land | Improvement |
|---|---|---|---|---|
| 2025 | $1,356 | $14,167 | -- | -- |
| 2024 | $1,341 | $13,492 | -- | -- |
| 2023 | $1,341 | $27,500 | $5,500 | $22,000 |
| 2022 | $1,332 | $20,660 | $4,130 | $16,530 |
| 2021 | $1,489 | $19,850 | $3,970 | $15,880 |
| 2020 | $1,409 | $17,570 | $3,510 | $14,060 |
| 2019 | $1,372 | $15,780 | $3,150 | $12,630 |
| 2018 | $1,272 | $15,460 | $3,090 | $12,370 |
| 2017 | $1,259 | $14,130 | $2,820 | $11,310 |
| 2016 | $1,063 | $13,300 | $2,660 | $10,640 |
| 2015 | $1,139 | $12,730 | $2,540 | $10,190 |
Source: Public Records
Map
Nearby Homes
- 5201 N 125th Ave
- 12542 W Orange Dr
- 12408 W Orange Dr
- 5374 N Ormondo Way
- 12323 W Medlock Dr
- 12714 W Colter St
- 12805 W Colter St
- 5502 N Ormondo Way
- 12721 W Georgia Ave
- 12804 W Georgia Ave
- 123XX W Estero Ln Unit 9
- 12803 W Missouri Ave
- 12866 W Orange Dr
- 12376 W Hazelwood St
- 12355 W Hazelwood St
- 12339 W Hazelwood St
- 12368 W Meadowbrook Ave
- 12631 W Segovia Dr
- 12952 W Vista Paseo Dr
- 20254 W Roma Ave
- 12517 W Medlock Dr
- 12509 W Medlock Dr
- 12521 W Medlock Dr Unit 85340
- 12521 W Medlock Dr
- 12508 W Windsor Blvd
- 12512 W Windsor Blvd
- 12516 W Windsor Blvd
- 12525 W Medlock Dr
- 5215 N 125th Dr
- 5228 N 125th Ave
- 12520 W Windsor Blvd
- 5213 N 125th Ave
- 5219 N 125th Dr
- 12531 W Medlock Dr
- 5217 N 125th Ave
- 5209 N 125th Ave
- 5232 N 125th Ave
- 5221 N 125th Ave
- 12524 W Windsor Blvd
- 5205 N 125th Ave