Estimated Value: $556,353 - $633,000
--
Bed
1
Bath
3,367
Sq Ft
$175/Sq Ft
Est. Value
About This Home
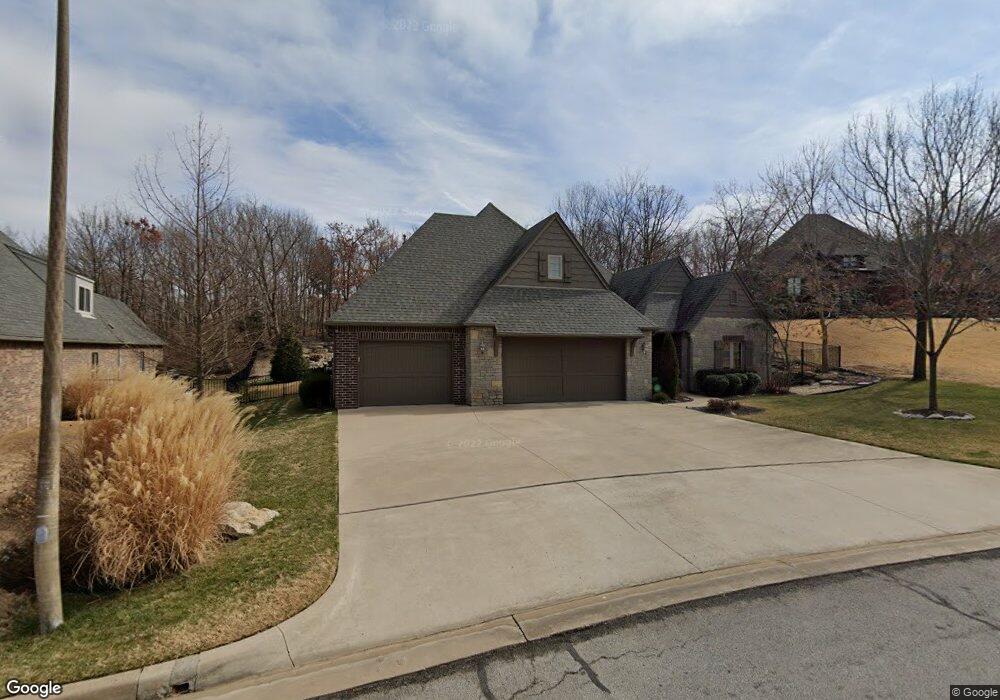
This home is located at 12515 S 15th Ct, Jenks, OK 74037 and is currently estimated at $590,588, approximately $175 per square foot. 12515 S 15th Ct is a home located in Tulsa County with nearby schools including Central Elementary School and Bixby Central Intermediate School.
Ownership History
Date
Name
Owned For
Owner Type
Purchase Details
Closed on
Jul 28, 2011
Sold by
May William S and May Michele C
Bought by
Sellens William Grogory and Sellens Peggy Jean
Current Estimated Value
Home Financials for this Owner
Home Financials are based on the most recent Mortgage that was taken out on this home.
Original Mortgage
$314,500
Outstanding Balance
$215,789
Interest Rate
4.53%
Mortgage Type
New Conventional
Estimated Equity
$374,799
Purchase Details
Closed on
Mar 14, 2008
Sold by
Lawrence Drew and Lawrence Scottie
Bought by
May William S and May Michele C
Home Financials for this Owner
Home Financials are based on the most recent Mortgage that was taken out on this home.
Original Mortgage
$50,000
Interest Rate
5.72%
Mortgage Type
Purchase Money Mortgage
Create a Home Valuation Report for This Property
The Home Valuation Report is an in-depth analysis detailing your home's value as well as a comparison with similar homes in the area
Home Values in the Area
Average Home Value in this Area
Purchase History
| Date | Buyer | Sale Price | Title Company |
|---|---|---|---|
| Sellens William Grogory | $349,500 | None Available | |
| May William S | $50,000 | First American Title & Abstr |
Source: Public Records
Mortgage History
| Date | Status | Borrower | Loan Amount |
|---|---|---|---|
| Open | Sellens William Grogory | $314,500 | |
| Previous Owner | May William S | $50,000 |
Source: Public Records
Tax History Compared to Growth
Tax History
| Year | Tax Paid | Tax Assessment Tax Assessment Total Assessment is a certain percentage of the fair market value that is determined by local assessors to be the total taxable value of land and additions on the property. | Land | Improvement |
|---|---|---|---|---|
| 2024 | $5,832 | $48,013 | $7,421 | $40,592 |
| 2023 | $5,832 | $45,726 | $7,654 | $38,072 |
| 2022 | $5,658 | $43,550 | $8,828 | $34,722 |
| 2021 | $5,661 | $43,550 | $8,828 | $34,722 |
| 2020 | $5,568 | $43,550 | $8,828 | $34,722 |
| 2019 | $5,618 | $43,550 | $8,828 | $34,722 |
| 2018 | $5,639 | $43,550 | $8,828 | $34,722 |
| 2017 | $5,636 | $43,550 | $8,828 | $34,722 |
| 2016 | $5,713 | $43,550 | $8,828 | $34,722 |
| 2015 | $5,378 | $43,550 | $8,828 | $34,722 |
| 2014 | $5,182 | $40,700 | $8,250 | $32,450 |
Source: Public Records
Map
Nearby Homes
- 12512 S 18th Cir E
- 12636 S 13th Place
- 12503 S 12th St
- 12212 S 14th Ct
- 1420 E 122nd Ct S
- 12116 S 14th Ct
- 12110 S 14th Ct
- 12207 S 12th Ct
- 12910 S 20th Place E
- 2052 E 128th Place S
- 2058 E 129th St S
- 13011 S 14th Place
- 2039 E 129th Place S
- 2104 E 128th Place S
- 2067 E 129th Place S
- 2044 E 129th Place S
- 2048 E 129th Place S
- 2052 E 129th Place S
- 2056 E 129th Place S
- 2068 E 129th Place S
- 12515 S 15th Ct
- 12511 S 15th Ct
- 0 15th Ct
- 12519 S 15th Ct
- 12508 S 15th Ct
- 12507 S 15th Ct
- 12523 S 15th Ct
- 12512 S 15th Ct
- 12515 S 18th Cir E
- 12513 S 18th Cir E
- 12517 S 18th Cir E
- 12522 S 15th Ct
- 13004 S 15th Ct
- 13002 S 15th Ct
- 0 S 15th Ct
- 12904 S 15th Ct
- 12516 S 15th Ct
- 12503 S 15th Ct
- 12501 S 13th Place
- 12503 S 13th Place