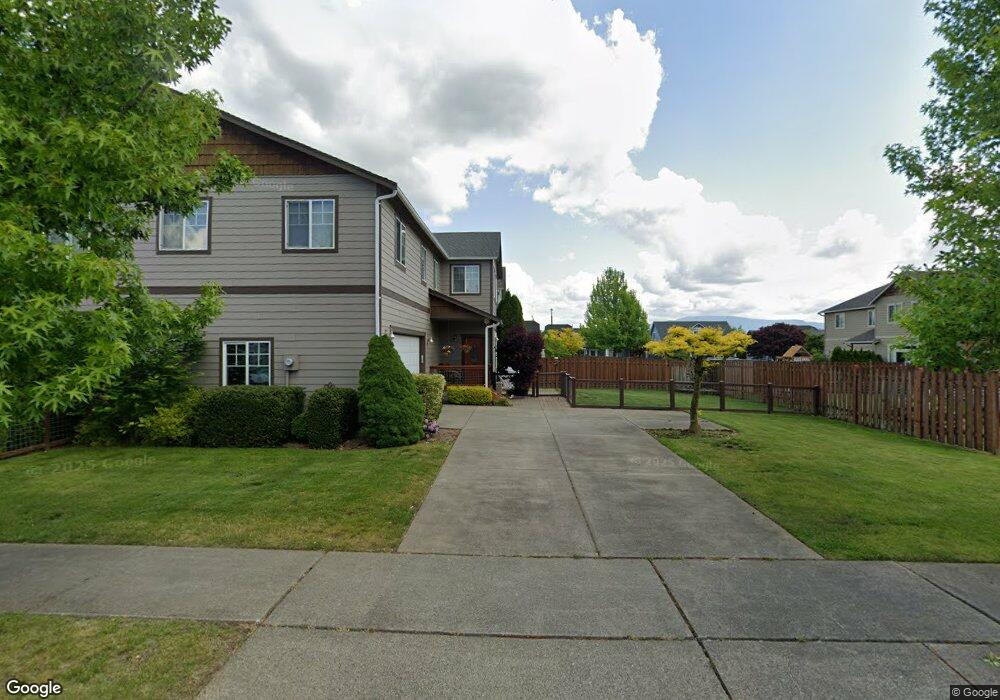
1252 Spruce Cir Unit B Lynden, WA 98264
Estimated Value: $459,000 - $519,945
3
Beds
3
Baths
1,966
Sq Ft
$251/Sq Ft
Est. Value
About This Home
This home is located at 1252 Spruce Cir Unit B, Lynden, WA 98264 and is currently estimated at $492,486, approximately $250 per square foot. 1252 Spruce Cir Unit B is a home located in Whatcom County with nearby schools including Lynden High School, Lynden Christian Schools: Administration, and Cornerstone Christian School.
Ownership History
Date
Name
Owned For
Owner Type
Purchase Details
Closed on
Feb 5, 2009
Sold by
Vanrooyen Phyllis L and Ponnech Phyllis L
Bought by
Vanrooyen Phyllis L and Vanrooyen Van Rooyen
Current Estimated Value
Home Financials for this Owner
Home Financials are based on the most recent Mortgage that was taken out on this home.
Original Mortgage
$185,000
Outstanding Balance
$114,847
Interest Rate
5.01%
Mortgage Type
Purchase Money Mortgage
Estimated Equity
$377,639
Purchase Details
Closed on
May 8, 2007
Sold by
Homestar Northwest Llc
Bought by
Ponnech Phyllis L
Home Financials for this Owner
Home Financials are based on the most recent Mortgage that was taken out on this home.
Original Mortgage
$149,725
Interest Rate
6.14%
Mortgage Type
Purchase Money Mortgage
Create a Home Valuation Report for This Property
The Home Valuation Report is an in-depth analysis detailing your home's value as well as a comparison with similar homes in the area
Home Values in the Area
Average Home Value in this Area
Purchase History
| Date | Buyer | Sale Price | Title Company |
|---|---|---|---|
| Vanrooyen Phyllis L | -- | Chicago Title Insurance | |
| Ponnech Phyllis L | $270,006 | Whatcom Land Title |
Source: Public Records
Mortgage History
| Date | Status | Borrower | Loan Amount |
|---|---|---|---|
| Open | Vanrooyen Phyllis L | $185,000 | |
| Closed | Ponnech Phyllis L | $149,725 |
Source: Public Records
Tax History
| Year | Tax Paid | Tax Assessment Tax Assessment Total Assessment is a certain percentage of the fair market value that is determined by local assessors to be the total taxable value of land and additions on the property. | Land | Improvement |
|---|---|---|---|---|
| 2025 | $3,587 | $479,780 | $50,750 | $429,030 |
| 2024 | $3,401 | $472,690 | $50,000 | $422,690 |
| 2023 | $3,401 | $472,690 | $50,000 | $422,690 |
| 2022 | $3,112 | $381,128 | $58,902 | $322,226 |
| 2021 | $3,108 | $337,282 | $52,125 | $285,157 |
| 2020 | $2,814 | $306,614 | $47,386 | $259,228 |
| 2019 | $2,496 | $290,620 | $44,914 | $245,706 |
| 2018 | $2,616 | $264,220 | $40,834 | $223,386 |
| 2017 | $2,106 | $227,480 | $35,156 | $192,324 |
| 2016 | $2,046 | $194,681 | $32,220 | $162,461 |
| 2015 | $1,744 | $188,126 | $30,960 | $157,166 |
| 2014 | -- | $174,731 | $28,770 | $145,961 |
| 2013 | -- | $172,773 | $28,500 | $144,273 |
Source: Public Records
Map
Nearby Homes
- 2274 Dogwood St
- 1171 Elm St
- 1372 Elm St
- 8885 Line Rd
- 1713 Aaron Dr
- 1725 Aaron Dr
- 2202 Berryman Loop
- 1660 Eastwood Way
- 2102 Shortcake Ln
- 1125 N Cascade Ct
- 1136 N Cascade Ct
- 807 E Maberry Dr
- 1580 Foxtail St
- 1484 Larkspur St
- 2075 Bluestem St
- 0 Bender Rd
- 1950 N Prairie Ln
- 1963 Bluestem St
- 1979 Woodsman Dr
- 790 E Badger Rd
- 1252 Spruce Cir Unit A
- 2277 Cherry St Unit 11B
- 1287 Spruce Cir Unit B
- 1287 Spruce Cir Unit A
- 1287 Spruce Cir
- 1263 Spruce Cir Unit 6B
- 1263 Spruce Cir Unit 6A
- 1263 Spruce Cir Unit A
- 1263 Spruce Cir Unit B
- 1290 Spruce St
- 2229 Cherry St Unit 12B
- 1255 Spruce Cir Unit B
- 1255 Spruce Cir Unit A
- 1255 Spruce Cir Unit 5B
- 1255 Spruce Cir Unit 5A
- 1279 Spruce Cir Unit A
- 1279 Spruce Cir Unit A & B
- 1271 Spruce Cir Unit B
- 1271 Spruce Cir Unit A
- 1271 Spruce Cir Unit 7B
Your Personal Tour Guide
Ask me questions while you tour the home.