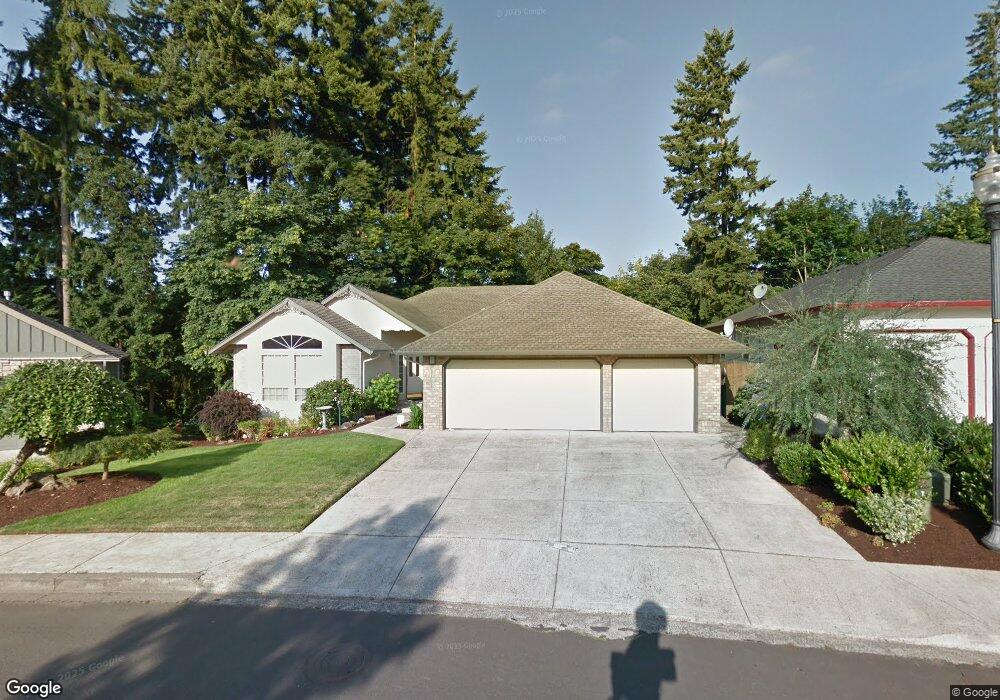
12520 NE Riley Ct Vancouver, WA 98686
Estimated Value: $690,173 - $876,000
4
Beds
2
Baths
2,434
Sq Ft
$314/Sq Ft
Est. Value
About This Home
This home is located at 12520 NE Riley Ct, Vancouver, WA 98686 and is currently estimated at $763,293, approximately $313 per square foot. 12520 NE Riley Ct is a home located in Clark County with nearby schools including Pleasant Valley Primary School, Pleasant Valley Middle School, and Prairie High School.
Ownership History
Date
Name
Owned For
Owner Type
Purchase Details
Closed on
Sep 21, 2011
Sold by
Roper Shirlene Joy Ann
Bought by
Francis Janice M and Slattery Sorel
Current Estimated Value
Home Financials for this Owner
Home Financials are based on the most recent Mortgage that was taken out on this home.
Original Mortgage
$135,000
Outstanding Balance
$91,693
Interest Rate
4.09%
Mortgage Type
New Conventional
Estimated Equity
$671,600
Purchase Details
Closed on
Jan 27, 2010
Sold by
Roper Shirlene Joy Ann
Bought by
Roper Shirlene Joy Ann
Purchase Details
Closed on
Apr 26, 2002
Sold by
Roper Shirlene
Bought by
Leaf Roger
Purchase Details
Closed on
Jan 15, 1997
Sold by
Nicewonger Construction Inc
Bought by
Leaf Roger and Roper Shirlene
Home Financials for this Owner
Home Financials are based on the most recent Mortgage that was taken out on this home.
Original Mortgage
$179,900
Interest Rate
7.58%
Purchase Details
Closed on
Jul 2, 1996
Sold by
Riley Kevin
Bought by
Nicewonger Construction Inc
Create a Home Valuation Report for This Property
The Home Valuation Report is an in-depth analysis detailing your home's value as well as a comparison with similar homes in the area
Home Values in the Area
Average Home Value in this Area
Purchase History
| Date | Buyer | Sale Price | Title Company |
|---|---|---|---|
| Francis Janice M | $295,000 | First American Title | |
| Roper Shirlene Joy Ann | -- | None Available | |
| Leaf Roger | -- | -- | |
| Leaf Roger | $261,648 | Charter Title Corp | |
| Nicewonger Construction Inc | $57,000 | Charter Title Corp |
Source: Public Records
Mortgage History
| Date | Status | Borrower | Loan Amount |
|---|---|---|---|
| Open | Francis Janice M | $135,000 | |
| Previous Owner | Leaf Roger | $179,900 |
Source: Public Records
Tax History Compared to Growth
Tax History
| Year | Tax Paid | Tax Assessment Tax Assessment Total Assessment is a certain percentage of the fair market value that is determined by local assessors to be the total taxable value of land and additions on the property. | Land | Improvement |
|---|---|---|---|---|
| 2025 | $5,139 | $646,736 | $193,050 | $453,686 |
| 2024 | $4,736 | $598,533 | $193,050 | $405,483 |
| 2023 | $4,685 | $613,169 | $202,800 | $410,369 |
| 2022 | $4,517 | $560,236 | $185,250 | $374,986 |
| 2021 | $4,599 | $490,343 | $132,000 | $358,343 |
| 2020 | $4,508 | $452,455 | $121,000 | $331,455 |
| 2019 | $3,974 | $431,853 | $121,000 | $310,853 |
| 2018 | $5,041 | $432,632 | $0 | $0 |
| 2017 | $4,407 | $418,392 | $0 | $0 |
| 2016 | $4,394 | $392,138 | $0 | $0 |
| 2015 | $4,439 | $359,843 | $0 | $0 |
| 2014 | -- | $343,568 | $0 | $0 |
| 2013 | -- | $301,927 | $0 | $0 |
Source: Public Records
Map
Nearby Homes
- 6401 NE 123rd St
- 12919 NE 37th Ct
- 12018 NE 45th Ave
- 4607 NE 126th Cir
- 4406 NE 130th St
- 3404 NE 128th St
- 3712 NE 131st St
- 4617 NE 128th St
- 13208 NE 43rd Ct
- 11716 NE 42nd Ct
- 12800 NE Salmon Creek Ave Unit 119
- 4604 NE 119th St
- 4405 NE 118th St
- 12215 NE Salmon Creek Ave
- 12207 NE 49th Place
- 11619 NE 36th Ct
- 4807 NE 132nd Cir
- 10112 NE 45th Ct
- 4413 NE 182nd St Unit 111
- 4419 NE 115th St
- 12522 NE Riley Ct
- 12510 NE Riley Ct
- 12524 NE Riley Ct
- 12513 NE Riley Ct
- 12521 NE Riley Ct
- 12504 NE Riley Ct
- 12523 NE Riley Ct
- 12605 NE 40th Ave
- 4209 NE 126th St
- 12502 NE Riley Ct
- 12604 NE 40th Ave
- 12600 NE 42nd Ave
- 12505 NE Riley Ct
- 12503 NE Riley Ct
- 4215 NE 126th St
- 12500 NE Riley Ct
- 12607 NE 40th Ave
- 12602 NE 42nd Ave
- 12606 NE 40th Ave
- 12420 NE 43rd Ave