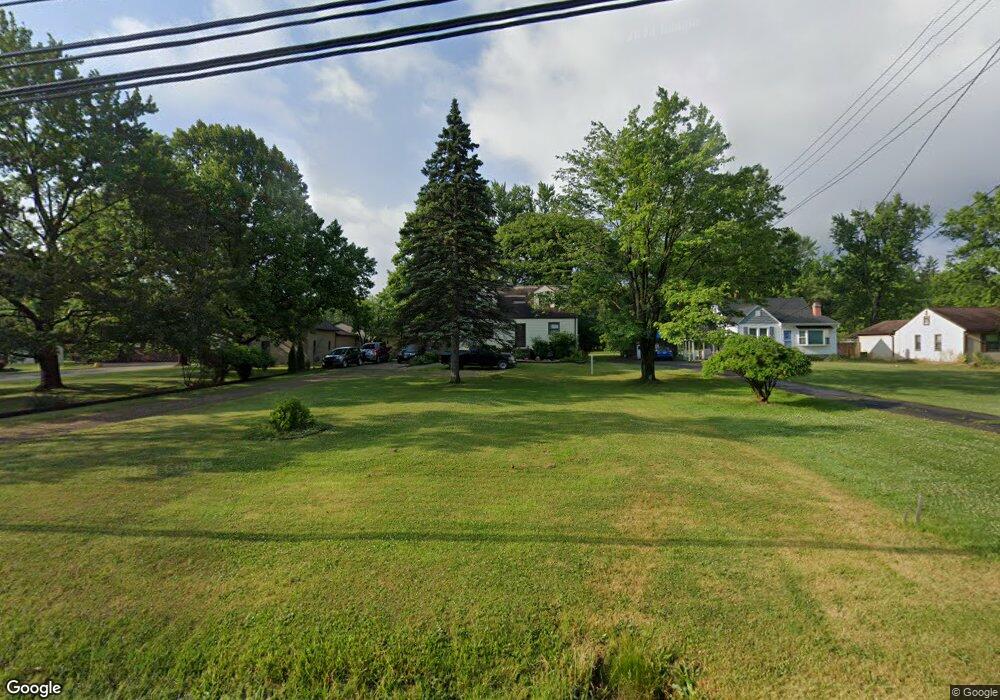
12521 Albion Rd North Royalton, OH 44133
Estimated Value: $267,000 - $289,000
4
Beds
3
Baths
1,296
Sq Ft
$217/Sq Ft
Est. Value
About This Home
This home is located at 12521 Albion Rd, North Royalton, OH 44133 and is currently estimated at $281,272, approximately $217 per square foot. 12521 Albion Rd is a home located in Cuyahoga County with nearby schools including North Royalton Middle School, North Royalton High School, and Bethel Christian Academy.
Ownership History
Date
Name
Owned For
Owner Type
Purchase Details
Closed on
Sep 15, 2021
Sold by
Lamanna Dominic J and Lamanna Sharon A
Bought by
Lamanna Dominic J and Lamanna Sharon A
Current Estimated Value
Purchase Details
Closed on
Mar 24, 2005
Sold by
Wonkovich John J and Wonkovich Janice M
Bought by
Craig Sharon A
Home Financials for this Owner
Home Financials are based on the most recent Mortgage that was taken out on this home.
Original Mortgage
$100,000
Interest Rate
5.64%
Mortgage Type
Purchase Money Mortgage
Purchase Details
Closed on
Feb 8, 2002
Sold by
Monkovich John G and Monkovich Donna R
Bought by
Wonkovich John J
Purchase Details
Closed on
Jun 27, 1990
Sold by
Williams Delmer L
Bought by
Nelson Lewis A
Purchase Details
Closed on
Nov 13, 1981
Sold by
Boost Peter M and Boost Irene
Bought by
Williams Delmer L
Purchase Details
Closed on
Jan 1, 1975
Bought by
Boost Peter M and Boost Irene
Create a Home Valuation Report for This Property
The Home Valuation Report is an in-depth analysis detailing your home's value as well as a comparison with similar homes in the area
Home Values in the Area
Average Home Value in this Area
Purchase History
| Date | Buyer | Sale Price | Title Company |
|---|---|---|---|
| Lamanna Dominic J | -- | Revere Title | |
| Craig Sharon A | $150,000 | Approved Statewide Title | |
| Wonkovich John J | -- | -- | |
| Nelson Lewis A | $95,000 | -- | |
| Williams Delmer L | $66,000 | -- | |
| Boost Peter M | -- | -- |
Source: Public Records
Mortgage History
| Date | Status | Borrower | Loan Amount |
|---|---|---|---|
| Previous Owner | Craig Sharon A | $100,000 |
Source: Public Records
Tax History Compared to Growth
Tax History
| Year | Tax Paid | Tax Assessment Tax Assessment Total Assessment is a certain percentage of the fair market value that is determined by local assessors to be the total taxable value of land and additions on the property. | Land | Improvement |
|---|---|---|---|---|
| 2024 | $4,762 | $81,970 | $15,575 | $66,395 |
| 2023 | $3,861 | $60,970 | $14,700 | $46,270 |
| 2022 | $3,835 | $60,970 | $14,700 | $46,270 |
| 2021 | $3,876 | $60,970 | $14,700 | $46,270 |
| 2020 | $3,516 | $52,570 | $12,670 | $39,900 |
| 2019 | $3,413 | $150,200 | $36,200 | $114,000 |
| 2018 | $3,284 | $52,570 | $12,670 | $39,900 |
| 2017 | $3,329 | $48,450 | $12,710 | $35,740 |
| 2016 | $3,119 | $48,450 | $12,710 | $35,740 |
| 2015 | $3,144 | $48,450 | $12,710 | $35,740 |
| 2014 | $3,144 | $48,450 | $12,710 | $35,740 |
Source: Public Records
Map
Nearby Homes
- 9938 Abbey Rd
- 10700 Abbey Rd
- 12721 Patricia Dr
- 13402 Bridgecreek Cir
- 12658 Gardenside Dr
- Buchanan Plan at The Enclave at Pine Lakes Crossing
- Belleville Plan at The Enclave at Pine Lakes Crossing
- 8963 Abbey Rd
- 11806 Harbour Light Dr Unit 1806
- 14069 Basswood Cir
- 10641 Albion Rd
- 11650 Harbour Light Dr Unit 1650
- 14644 Baywood Ln
- 14584 Baywood Ln
- 14557 Baywood Ln
- 8981 Edgewood Dr
- 12631 Pinebrook Dr
- 8960 Wildwood Dr
- 9901 Beechwood Dr
- 8761 Windfall Ct
- 12489 Albion Rd
- 12589 Albion Rd
- 12451 Albion Rd
- 12419 Albion Rd
- 12619 Albion Rd
- 12500 Albion Rd
- 12470 Albion Rd
- 12383 Albion Rd
- 12550 Albion Rd
- 12671 Albion Rd
- 12438 Albion Rd
- 12596 Albion Rd
- 12034 Albion Rd
- 12349 Albion Rd
- 12652 Albion Rd
- 12725 Albion Rd
- 12317 Albion Rd
- 12317 Albion Rd
- 12010 Albion Rd
- 12706 Albion Rd