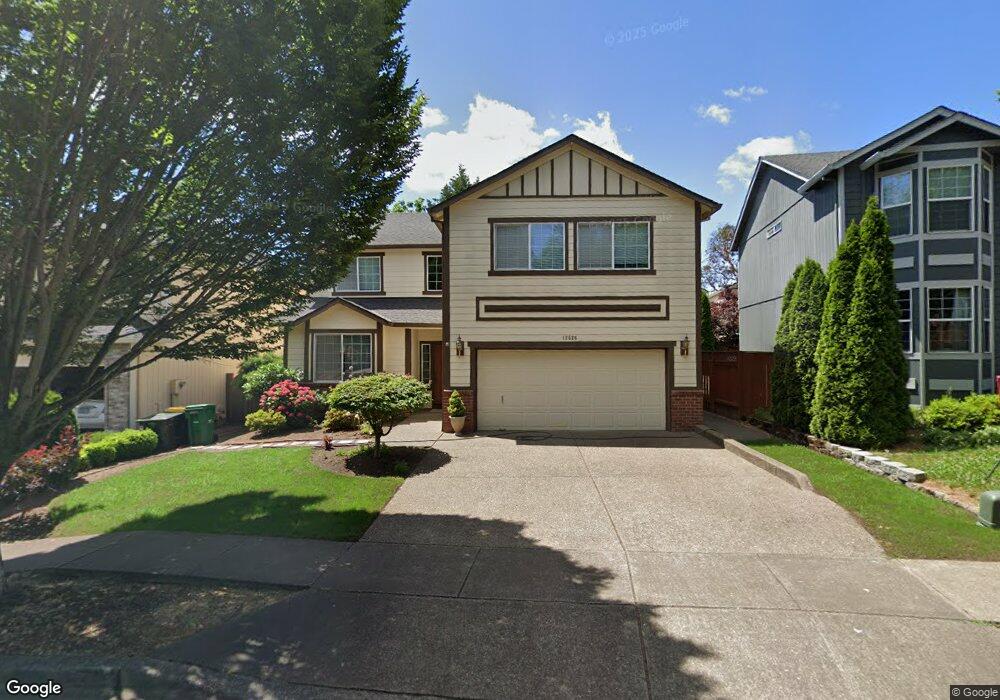
12526 SW Canvasback Way Beaverton, OR 97007
Neighbors Southwest NeighborhoodEstimated Value: $643,427 - $697,000
5
Beds
3
Baths
2,520
Sq Ft
$264/Sq Ft
Est. Value
About This Home
This home is located at 12526 SW Canvasback Way, Beaverton, OR 97007 and is currently estimated at $664,607, approximately $263 per square foot. 12526 SW Canvasback Way is a home located in Washington County with nearby schools including Scholls Heights Elementary School, Conestoga Middle School, and Mountainside High School.
Ownership History
Date
Name
Owned For
Owner Type
Purchase Details
Closed on
Jul 29, 2008
Sold by
Pham Jennifer Kong
Bought by
Hixson Somanchi Stephanie L and Somanchi Subbarao
Current Estimated Value
Purchase Details
Closed on
Jul 22, 2008
Sold by
Kong Tunly H
Bought by
Pham Jennifer Kong
Purchase Details
Closed on
Jan 22, 2008
Sold by
Kong Tunly H
Bought by
Pham Jennifer Kong
Purchase Details
Closed on
Nov 30, 2000
Sold by
Pham Long and Pham Jennifer
Bought by
Kong Tunly
Purchase Details
Closed on
Oct 8, 1999
Sold by
Pacific Ridge Inc
Bought by
Pham Long and Pham Jennifer
Home Financials for this Owner
Home Financials are based on the most recent Mortgage that was taken out on this home.
Original Mortgage
$163,200
Interest Rate
7.77%
Create a Home Valuation Report for This Property
The Home Valuation Report is an in-depth analysis detailing your home's value as well as a comparison with similar homes in the area
Home Values in the Area
Average Home Value in this Area
Purchase History
| Date | Buyer | Sale Price | Title Company |
|---|---|---|---|
| Hixson Somanchi Stephanie L | $297,000 | Pacific Northwest Title Of O | |
| Pham Jennifer Kong | -- | Pacific Northwest Title Of O | |
| Pham Jennifer Kong | $180,000 | None Available | |
| Kong Tunly | -- | Fidelity National Title Co | |
| Pham Long | $204,897 | First American Title Co |
Source: Public Records
Mortgage History
| Date | Status | Borrower | Loan Amount |
|---|---|---|---|
| Previous Owner | Pham Long | $163,200 |
Source: Public Records
Tax History Compared to Growth
Tax History
| Year | Tax Paid | Tax Assessment Tax Assessment Total Assessment is a certain percentage of the fair market value that is determined by local assessors to be the total taxable value of land and additions on the property. | Land | Improvement |
|---|---|---|---|---|
| 2026 | $7,919 | $386,570 | -- | -- |
| 2025 | $7,919 | $375,320 | -- | -- |
| 2024 | $7,476 | $364,390 | -- | -- |
| 2023 | $7,476 | $353,780 | $0 | $0 |
| 2022 | $7,156 | $353,780 | $0 | $0 |
| 2021 | $6,905 | $333,480 | $0 | $0 |
| 2020 | $6,695 | $323,770 | $0 | $0 |
| 2019 | $6,483 | $314,340 | $0 | $0 |
| 2018 | $6,276 | $305,190 | $0 | $0 |
| 2017 | $6,042 | $296,310 | $0 | $0 |
| 2016 | $5,832 | $287,680 | $0 | $0 |
| 2015 | $5,615 | $279,310 | $0 | $0 |
| 2014 | $5,495 | $271,180 | $0 | $0 |
Source: Public Records
Map
Nearby Homes
- 12697 SW Canvasback Way
- 16140 SW Puffin Ct
- 12365 Curlew Way
- 12450 Curlew Way
- 12420 SW Harlequin Dr
- Sellwood Plan at Heights at Cooper Mountain
- Burlington Plan at Heights at Cooper Mountain
- Bainbridge Plan at Heights at Cooper Mountain
- Jade Plan at Heights at Cooper Mountain
- Pecan Plan at Heights at Cooper Mountain
- Endicott Plan at Heights at Cooper Mountain
- Ashley Plan at Heights at Cooper Mountain
- Magnolia Plan at Heights at Cooper Mountain
- Hazel Plan at Heights at Cooper Mountain
- Cambridge Plan at Heights at Cooper Mountain
- Ivy Plan at Heights at Cooper Mountain
- Alpine Plan at Heights at Cooper Mountain
- Marigold Plan at Heights at Cooper Mountain
- 15365 SW Mallard Dr Unit 104
- 12263 SW Bittern Terrace
- 12512 SW Canvasback Way
- 12534 SW Canvasback Way
- 16115 SW Whistling Swan Ln Unit 226
- 16095 SW Whistling Swan Ln Unit 227
- 12548 SW Canvasback Way
- 16145 SW Whistling Swan Ln Unit 225
- 12508 SW Canvasback Way
- 16075 SW Whistling Swan Ln
- 12527 SW Canvasback Way
- 12675 SW 160th Terrace
- 12539 SW Canvasback Way Unit T
- 12539 SW Canvasback Way
- 12552 SW Canvasback Way
- 12511 SW Canvasback Way
- 12547 SW Canvasback Way
- 12568 SW Canvasback Way
- 12492 SW Canvasback Way
- 12559 SW Canvasback Way
- 12483 SW Canvasback Way
- 16060 SW Catbird Ln