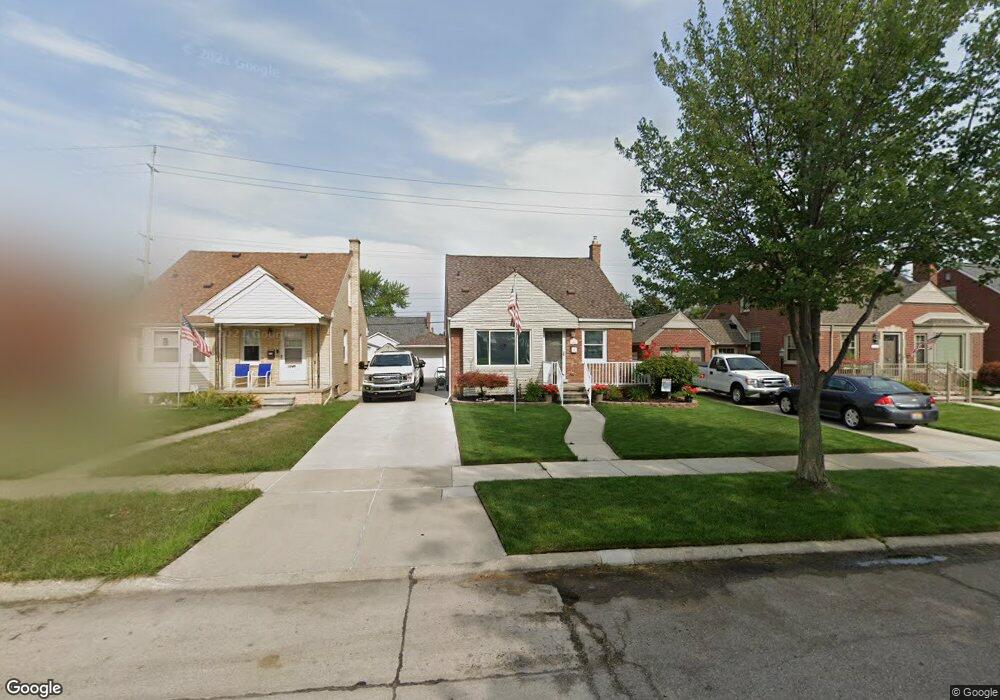
1253 13th St Wyandotte, MI 48192
Estimated Value: $184,107 - $228,000
--
Bed
1
Bath
1,112
Sq Ft
$187/Sq Ft
Est. Value
About This Home
This home is located at 1253 13th St, Wyandotte, MI 48192 and is currently estimated at $208,277, approximately $187 per square foot. 1253 13th St is a home located in Wayne County with nearby schools including Jefferson Elementary School, Woodrow Wilson School, and Roosevelt High School.
Ownership History
Date
Name
Owned For
Owner Type
Purchase Details
Closed on
Sep 10, 2019
Sold by
Desana Robert A and Robert Desana Trust
Bought by
Shifflett Aaron D and Shifflett Autumn M
Current Estimated Value
Home Financials for this Owner
Home Financials are based on the most recent Mortgage that was taken out on this home.
Original Mortgage
$138,225
Outstanding Balance
$120,825
Interest Rate
3.5%
Mortgage Type
New Conventional
Estimated Equity
$87,452
Purchase Details
Closed on
Jan 10, 2007
Sold by
Desana Robert
Bought by
Desana Robert and Robert Desana Trust
Purchase Details
Closed on
May 18, 2000
Sold by
Allard Dorothy
Bought by
Robert A Desana
Create a Home Valuation Report for This Property
The Home Valuation Report is an in-depth analysis detailing your home's value as well as a comparison with similar homes in the area
Home Values in the Area
Average Home Value in this Area
Purchase History
| Date | Buyer | Sale Price | Title Company |
|---|---|---|---|
| Shifflett Aaron D | $142,500 | None Available | |
| Desana Robert | -- | None Available | |
| Robert A Desana | $116,000 | -- |
Source: Public Records
Mortgage History
| Date | Status | Borrower | Loan Amount |
|---|---|---|---|
| Open | Shifflett Aaron D | $138,225 |
Source: Public Records
Tax History Compared to Growth
Tax History
| Year | Tax Paid | Tax Assessment Tax Assessment Total Assessment is a certain percentage of the fair market value that is determined by local assessors to be the total taxable value of land and additions on the property. | Land | Improvement |
|---|---|---|---|---|
| 2025 | $2,731 | $90,500 | $0 | $0 |
| 2024 | $2,731 | $83,200 | $0 | $0 |
| 2023 | $2,604 | $75,900 | $0 | $0 |
| 2022 | $3,016 | $67,500 | $0 | $0 |
| 2021 | $2,956 | $60,400 | $0 | $0 |
| 2020 | $2,916 | $53,400 | $0 | $0 |
| 2019 | $2,246 | $49,600 | $0 | $0 |
| 2018 | $1,793 | $48,400 | $0 | $0 |
| 2017 | $783 | $48,400 | $0 | $0 |
| 2016 | $2,164 | $44,000 | $0 | $0 |
| 2015 | $3,861 | $40,900 | $0 | $0 |
| 2013 | $3,740 | $37,400 | $0 | $0 |
| 2012 | $1,769 | $39,200 | $6,300 | $32,900 |
Source: Public Records
Map
Nearby Homes