Estimated Value: $626,867 - $706,000
4
Beds
3
Baths
2,503
Sq Ft
$267/Sq Ft
Est. Value
About This Home
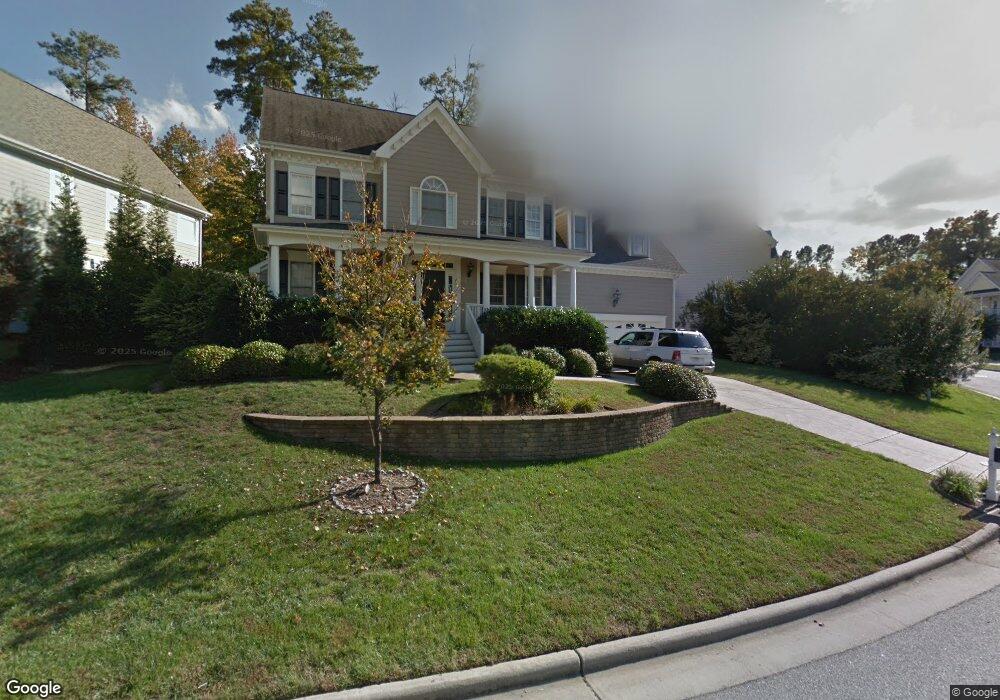
This home is located at 1253 Dalgarven Dr, Apex, NC 27502 and is currently estimated at $668,217, approximately $266 per square foot. 1253 Dalgarven Dr is a home located in Wake County with nearby schools including Scotts Ridge Elementary School, Apex Middle, and Apex High School.
Ownership History
Date
Name
Owned For
Owner Type
Purchase Details
Closed on
Jul 18, 2014
Sold by
Rotondo Denise M and Kincaid Joel F
Bought by
Lewis Victor and Lewis Melissa A
Current Estimated Value
Home Financials for this Owner
Home Financials are based on the most recent Mortgage that was taken out on this home.
Original Mortgage
$263,200
Outstanding Balance
$201,079
Interest Rate
4.24%
Mortgage Type
New Conventional
Estimated Equity
$467,138
Purchase Details
Closed on
Apr 19, 2006
Sold by
Lam Trung K and Tran Vianna P
Bought by
Kincaid Joel F and Rotondo Denise M
Home Financials for this Owner
Home Financials are based on the most recent Mortgage that was taken out on this home.
Original Mortgage
$239,900
Interest Rate
6.29%
Mortgage Type
Purchase Money Mortgage
Purchase Details
Closed on
Nov 15, 2002
Sold by
Sutton Homes Llc
Bought by
Lam Trung K and Tran Vianna P
Home Financials for this Owner
Home Financials are based on the most recent Mortgage that was taken out on this home.
Original Mortgage
$209,920
Interest Rate
4.87%
Create a Home Valuation Report for This Property
The Home Valuation Report is an in-depth analysis detailing your home's value as well as a comparison with similar homes in the area
Purchase History
| Date | Buyer | Sale Price | Title Company |
|---|---|---|---|
| Lewis Victor | $329,000 | None Available | |
| Kincaid Joel F | $300,000 | None Available | |
| Lam Trung K | $262,500 | -- |
Source: Public Records
Mortgage History
| Date | Status | Borrower | Loan Amount |
|---|---|---|---|
| Open | Lewis Victor | $263,200 | |
| Previous Owner | Kincaid Joel F | $239,900 | |
| Previous Owner | Lam Trung K | $209,920 | |
| Closed | Lam Trung K | $39,360 |
Source: Public Records
Tax History
| Year | Tax Paid | Tax Assessment Tax Assessment Total Assessment is a certain percentage of the fair market value that is determined by local assessors to be the total taxable value of land and additions on the property. | Land | Improvement |
|---|---|---|---|---|
| 2025 | $5,337 | $608,937 | $180,000 | $428,937 |
| 2024 | $5,217 | $608,937 | $180,000 | $428,937 |
Source: Public Records
Map
Nearby Homes
- 1224 Tartarian Trail
- 1006 Cherokee Sunset Rd
- 1303 Goldspot Ct
- 3021 White Cloud Cir
- 1210 Evian Ct
- 107 Maple Crest Ct
- 400 Village Loop Dr
- 1314 Chenworth Dr
- 1305 Olde Walker Mill Rd
- 0 Jb Morgan Rd Unit 10051948
- 101 Rocklyn Ln
- 440 Oak Pine Dr
- 470 Magdala Place
- 1004 Wild Sonnet Ct
- 1200 Fairfax Woods Dr
- 100 Henson Place
- 1111 Fairfax Woods Dr
- 1002 Tribble Gate Ct
- 101 Graystar Rd
- 2113 Barrier Ridge Way
- 1261 Dalgarven Dr
- 1269 Dalgarven Dr
- 1237 Dalgarven Dr
- 1032 Manderston Ln
- 1244 Dalgarven Dr
- 1256 Dalgarven Dr
- 1252 Dalgarven Dr
- 1277 Dalgarven Dr
- 1260 Dalgarven Dr
- 1240 Dalgarven Dr
- 1028 Manderston Ln
- 1233 Dalgarven Dr
- 1248 Dalgarven Dr
- 1236 Dalgarven Dr
- 1264 Dalgarven Dr
- 1024 Manderston Ln
- 1229 Dalgarven Dr
- 1268 Dalgarven Dr
- 1504 Redwater Branch Ct
- 1272 Dalgarven Dr
Your Personal Tour Guide
Ask me questions while you tour the home.