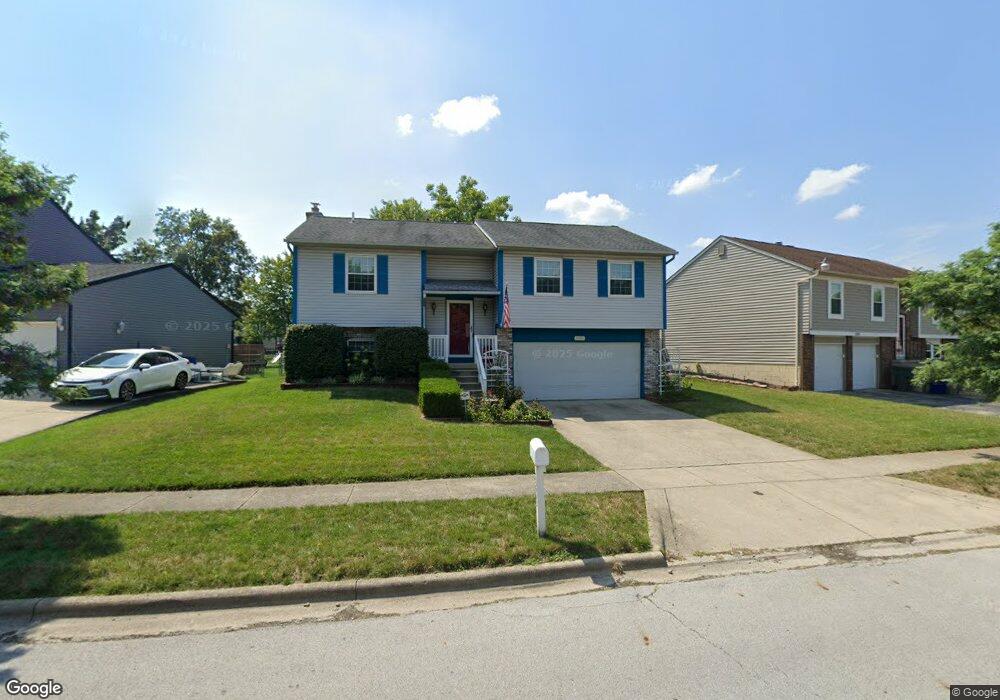
1253 Eagle View Dr Columbus, OH 43228
Riverbend NeighborhoodEstimated Value: $274,006 - $296,000
3
Beds
3
Baths
1,700
Sq Ft
$166/Sq Ft
Est. Value
About This Home
This home is located at 1253 Eagle View Dr, Columbus, OH 43228 and is currently estimated at $282,752, approximately $166 per square foot. 1253 Eagle View Dr is a home located in Franklin County with nearby schools including West Franklin Elementary School, Franklin Woods Intermediate School, and Finland Middle School.
Ownership History
Date
Name
Owned For
Owner Type
Purchase Details
Closed on
Nov 16, 2007
Sold by
Skiba Terence G
Bought by
Skiba Terence G and Stephens Coy E
Current Estimated Value
Purchase Details
Closed on
Feb 28, 2003
Sold by
Groves Paul M and Groves Tamara L
Bought by
Skiba Terence G
Home Financials for this Owner
Home Financials are based on the most recent Mortgage that was taken out on this home.
Original Mortgage
$124,900
Interest Rate
4.62%
Mortgage Type
Purchase Money Mortgage
Purchase Details
Closed on
Nov 1, 1995
Sold by
Gay Ewotha
Bought by
Groves Paul M and Groves Tamara L
Home Financials for this Owner
Home Financials are based on the most recent Mortgage that was taken out on this home.
Original Mortgage
$93,763
Interest Rate
7.61%
Mortgage Type
FHA
Purchase Details
Closed on
Oct 23, 1990
Create a Home Valuation Report for This Property
The Home Valuation Report is an in-depth analysis detailing your home's value as well as a comparison with similar homes in the area
Home Values in the Area
Average Home Value in this Area
Purchase History
| Date | Buyer | Sale Price | Title Company |
|---|---|---|---|
| Skiba Terence G | $65,500 | Attorney | |
| Skiba Terence G | $124,900 | Title First Agency Inc | |
| Groves Paul M | $96,000 | -- | |
| -- | $91,500 | -- |
Source: Public Records
Mortgage History
| Date | Status | Borrower | Loan Amount |
|---|---|---|---|
| Previous Owner | Skiba Terence G | $124,900 | |
| Previous Owner | Groves Paul M | $93,763 |
Source: Public Records
Tax History
| Year | Tax Paid | Tax Assessment Tax Assessment Total Assessment is a certain percentage of the fair market value that is determined by local assessors to be the total taxable value of land and additions on the property. | Land | Improvement |
|---|---|---|---|---|
| 2025 | $3,060 | $83,930 | $22,050 | $61,880 |
| 2024 | $3,060 | $83,930 | $22,050 | $61,880 |
| 2023 | $3,006 | $83,930 | $22,050 | $61,880 |
| 2022 | $2,569 | $52,640 | $8,400 | $44,240 |
| 2021 | $2,621 | $52,640 | $8,400 | $44,240 |
| 2020 | $2,606 | $52,640 | $8,400 | $44,240 |
| 2019 | $2,449 | $43,650 | $7,000 | $36,650 |
| 2018 | $2,326 | $43,650 | $7,000 | $36,650 |
| 2017 | $2,381 | $43,650 | $7,000 | $36,650 |
| 2016 | $2,336 | $38,610 | $6,020 | $32,590 |
| 2015 | $2,336 | $38,610 | $6,020 | $32,590 |
| 2014 | $2,338 | $38,610 | $6,020 | $32,590 |
| 2013 | $1,288 | $42,875 | $6,685 | $36,190 |
Source: Public Records
Map
Nearby Homes
- 4400 Honeywood Ct
- 4459 Amwood St
- 4474 Greystone Village Dr Unit 5D
- 4531 White Leaf Way
- 4655 Parkwick Dr
- 4518 Hall Rd
- 982 Melwood Dr
- 3997 Briggs Rd
- 868 Harwood Dr
- 1800 Georgesville Square Dr
- 3977 Sexton Dr
- 3859 Briggs Rd
- 1710 Carrigallen Ln
- 3860 Briggs Rd
- 3664-3670 Mccarley Dr S
- 3721 Briggs Rd Unit 723
- 3866 Eakin Rd
- 1842 Bashan Dr Unit 75F
- 4633 Parrau Dr Unit 70F
- 1490 Demorest Rd
- 1245 Eagle View Dr
- 1261 Eagle View Dr
- 1269 Eagle View Dr
- 1237 Eagle View Dr
- 4341 Honeywood Ct
- 1236 Eagle View Dr
- 4344 Honeywood Ct
- 1228 Eagle View Dr
- 4341 Hickory Wood Dr
- 1252 Eagle View Dr
- 1220 Eagle View Dr
- 1244 Eagle View Dr
- 1260 Eagle View Dr
- 1212 Eagle View Dr
- 1268 Eagle View Dr
- 4347 Hickory Wood Dr
- 4352 Honeywood Ct
- 4353 Honeywood Ct
- 1276 Eagle View Dr
- 4342 Eagle View Ct
Your Personal Tour Guide
Ask me questions while you tour the home.