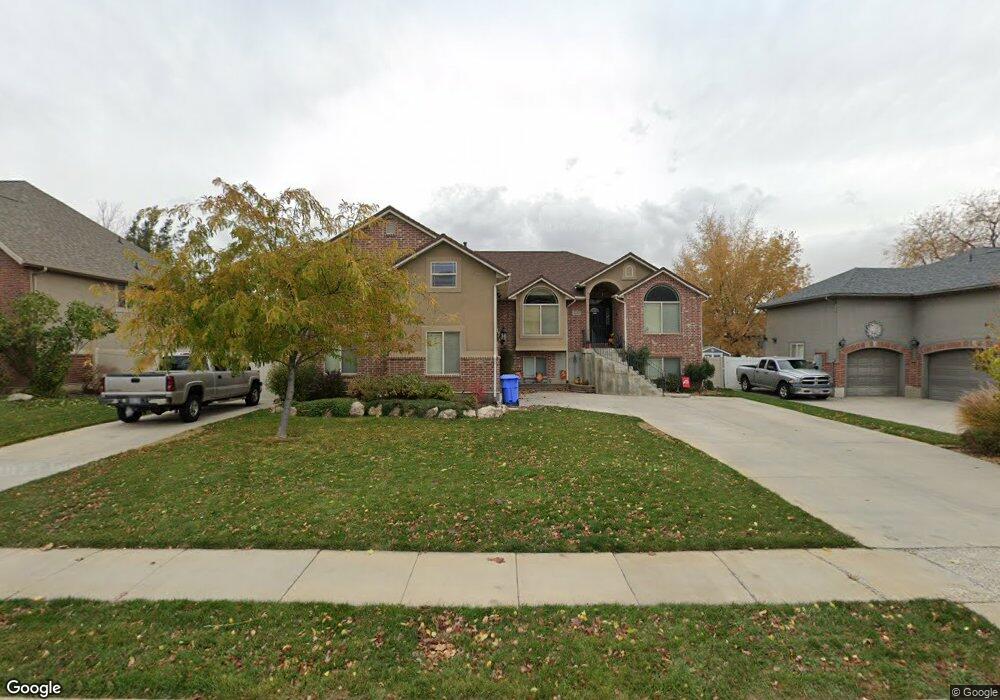
1253 N 640 W West Bountiful, UT 84087
Estimated Value: $610,000 - $984,000
3
Beds
2
Baths
2,544
Sq Ft
$315/Sq Ft
Est. Value
About This Home
This home is located at 1253 N 640 W, West Bountiful, UT 84087 and is currently estimated at $801,950, approximately $315 per square foot. 1253 N 640 W is a home located in Davis County with nearby schools including West Bountiful Elementary School, Bountiful Junior High School, and Viewmont High School.
Ownership History
Date
Name
Owned For
Owner Type
Purchase Details
Closed on
Apr 20, 2004
Sold by
Triples Development Inc
Bought by
Samuelsen Scott A and Samuelsen Corie A
Current Estimated Value
Create a Home Valuation Report for This Property
The Home Valuation Report is an in-depth analysis detailing your home's value as well as a comparison with similar homes in the area
Home Values in the Area
Average Home Value in this Area
Purchase History
| Date | Buyer | Sale Price | Title Company |
|---|---|---|---|
| Samuelsen Scott A | -- | Aspen Title Ins Agency L |
Source: Public Records
Tax History Compared to Growth
Tax History
| Year | Tax Paid | Tax Assessment Tax Assessment Total Assessment is a certain percentage of the fair market value that is determined by local assessors to be the total taxable value of land and additions on the property. | Land | Improvement |
|---|---|---|---|---|
| 2025 | $4,476 | $391,050 | $155,191 | $235,859 |
| 2024 | $4,388 | $393,250 | $128,068 | $265,182 |
| 2023 | $4,400 | $724,000 | $239,075 | $484,925 |
| 2022 | $4,504 | $414,700 | $117,221 | $297,479 |
| 2021 | $4,208 | $595,000 | $162,967 | $432,033 |
| 2020 | $3,806 | $532,000 | $147,402 | $384,598 |
| 2019 | $3,805 | $526,000 | $145,767 | $380,233 |
| 2018 | $3,640 | $495,000 | $141,522 | $353,478 |
| 2016 | $3,167 | $232,595 | $41,464 | $191,131 |
| 2015 | $3,276 | $228,690 | $41,464 | $187,226 |
| 2014 | $3,254 | $233,145 | $41,464 | $191,681 |
| 2013 | -- | $177,918 | $51,406 | $126,512 |
Source: Public Records
Map
Nearby Homes
- 637 W 1600 N
- 825 W 1320 N
- 366 W 1000 N
- Lincoln Farmhouse Plan at Belmont Farms
- Belmont Traditional Plan at Belmont Farms
- Hampton Traditional Plan at Belmont Farms
- 790 N 500 W
- 1503 N 300 W
- 235 W 1400 N
- 1194 N 200 W
- 1410 N 200 W
- 789 W 1950 N
- 1260 N 200 W
- 184 Park Shadows Cir
- 340 N 500 W Unit 204
- 1552 N 200 W
- 553 N 200 W
- 399 W 400 N Unit 47
- 810 Park Shadows Cir
- 239 Lyman Ln