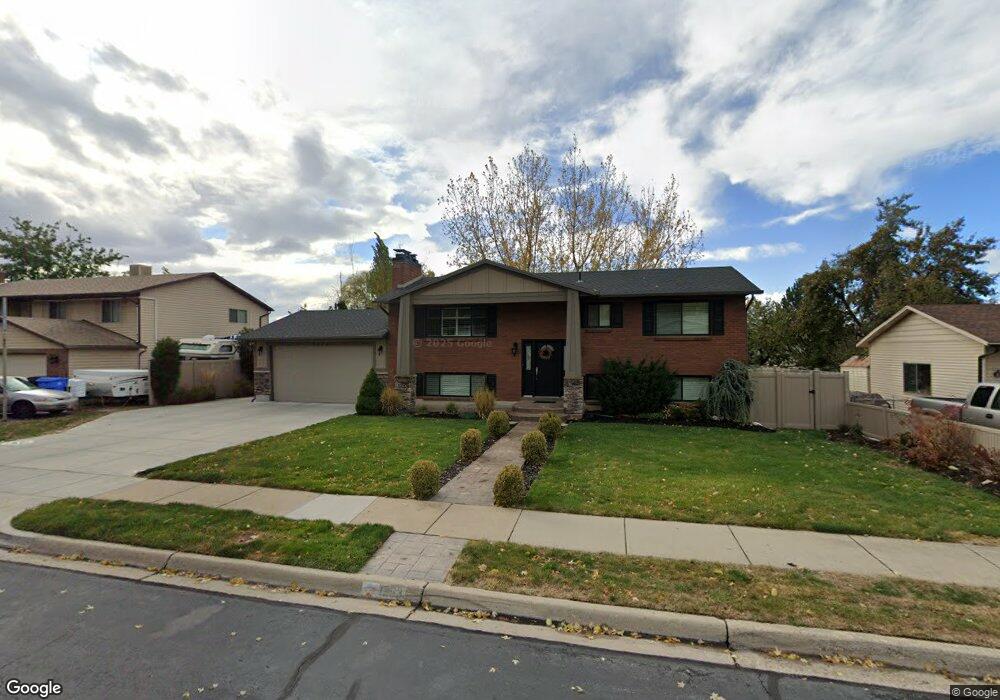
1253 N 725 W West Bountiful, UT 84087
Estimated Value: $494,000 - $551,000
--
Bed
3
Baths
1,075
Sq Ft
$487/Sq Ft
Est. Value
About This Home
This home is located at 1253 N 725 W, West Bountiful, UT 84087 and is currently estimated at $523,296, approximately $486 per square foot. 1253 N 725 W is a home located in Davis County with nearby schools including West Bountiful Elementary School, Bountiful Junior High School, and Viewmont High School.
Ownership History
Date
Name
Owned For
Owner Type
Purchase Details
Closed on
Jan 12, 2012
Sold by
Thompson Roxanne F and Thompson Benjamin John
Bought by
Thompson Benjamin J and Thompson Roxanne F
Current Estimated Value
Home Financials for this Owner
Home Financials are based on the most recent Mortgage that was taken out on this home.
Original Mortgage
$170,050
Interest Rate
3.93%
Mortgage Type
New Conventional
Purchase Details
Closed on
Jan 28, 2009
Sold by
Thompson Russell E and Thompson Roxanne F
Bought by
Thompson Roxanne F and Thompson Benjamin John
Create a Home Valuation Report for This Property
The Home Valuation Report is an in-depth analysis detailing your home's value as well as a comparison with similar homes in the area
Home Values in the Area
Average Home Value in this Area
Purchase History
| Date | Buyer | Sale Price | Title Company |
|---|---|---|---|
| Thompson Benjamin J | -- | Aspen Title Insuranc | |
| Thompson Roxanne F | -- | Aspen Title Insurance Ag |
Source: Public Records
Mortgage History
| Date | Status | Borrower | Loan Amount |
|---|---|---|---|
| Closed | Thompson Benjamin J | $170,050 |
Source: Public Records
Tax History Compared to Growth
Tax History
| Year | Tax Paid | Tax Assessment Tax Assessment Total Assessment is a certain percentage of the fair market value that is determined by local assessors to be the total taxable value of land and additions on the property. | Land | Improvement |
|---|---|---|---|---|
| 2025 | $3,301 | $271,150 | $131,171 | $139,979 |
| 2024 | $2,917 | $260,150 | $107,626 | $152,524 |
| 2023 | $2,884 | $473,000 | $205,317 | $267,683 |
| 2022 | $2,913 | $267,301 | $97,125 | $170,176 |
| 2021 | $2,543 | $357,000 | $128,556 | $228,444 |
| 2020 | $2,183 | $302,000 | $121,216 | $180,784 |
| 2019 | $2,124 | $291,000 | $123,867 | $167,133 |
| 2018 | $2,020 | $273,000 | $126,494 | $146,506 |
| 2016 | $1,764 | $129,525 | $30,902 | $98,623 |
| 2015 | $1,745 | $121,880 | $30,902 | $90,978 |
| 2014 | $1,752 | $125,997 | $30,708 | $95,289 |
| 2013 | -- | $90,785 | $26,080 | $64,705 |
Source: Public Records
Map
Nearby Homes
- 825 W 1320 N
- 637 W 1600 N
- 366 W 1000 N
- 790 N 500 W
- Lincoln Farmhouse Plan at Belmont Farms
- Belmont Traditional Plan at Belmont Farms
- Hampton Traditional Plan at Belmont Farms
- 789 W 1950 N
- 1503 N 300 W
- 1084 W Audrey Ln Unit 20
- 1084 W Audrey Ln
- 235 W 1400 N
- 2035 N 800 W
- 767 W 220 N
- 340 N 500 W Unit 204
- 1194 N 200 W
- 1410 N 200 W
- 399 W 400 N Unit 47
- 1260 N 200 W
- 580 W 2125 N