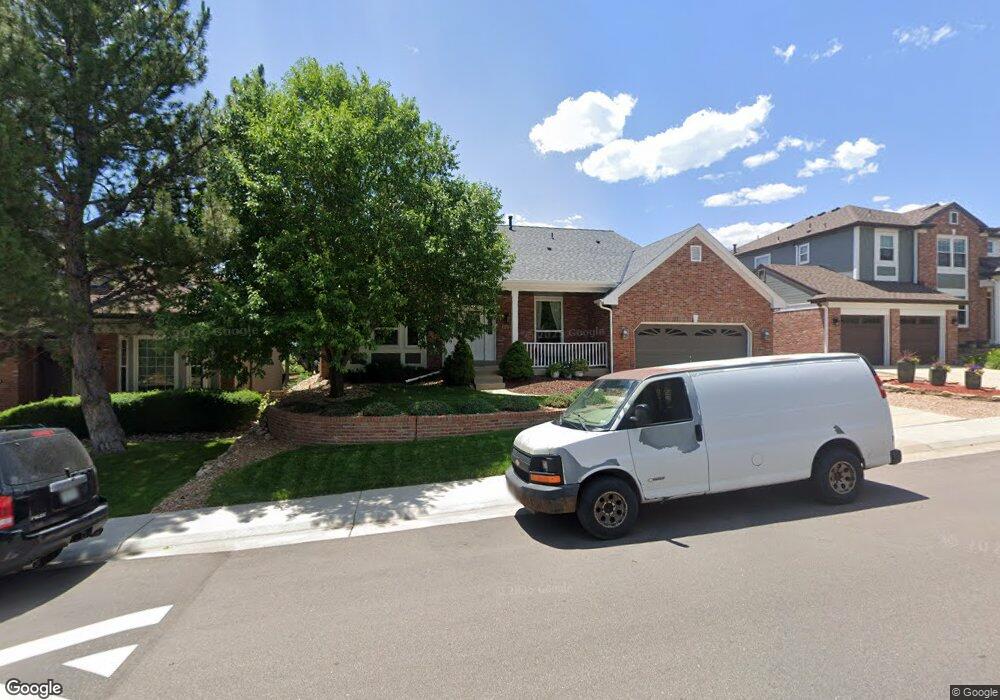
12530 W Auburn Ave Denver, CO 80228
Hutchinson Green Mountain NeighborhoodEstimated Value: $877,121 - $1,084,000
2
Beds
3
Baths
2,449
Sq Ft
$410/Sq Ft
Est. Value
About This Home
This home is located at 12530 W Auburn Ave, Denver, CO 80228 and is currently estimated at $1,004,030, approximately $409 per square foot. 12530 W Auburn Ave is a home located in Jefferson County with nearby schools including Devinny Elementary School, Dunstan Middle School, and Green Mountain High School.
Ownership History
Date
Name
Owned For
Owner Type
Purchase Details
Closed on
Apr 10, 2020
Sold by
Garage Brian R and Gorage Brooke M
Bought by
Garage Brian R and Garagr Brooke M
Current Estimated Value
Home Financials for this Owner
Home Financials are based on the most recent Mortgage that was taken out on this home.
Original Mortgage
$450,000
Outstanding Balance
$397,123
Interest Rate
3.2%
Mortgage Type
New Conventional
Estimated Equity
$606,907
Purchase Details
Closed on
Aug 22, 2013
Sold by
Studt William John and Studt Zamie Ann
Bought by
The Bokrus Trust
Purchase Details
Closed on
Dec 3, 1993
Sold by
April Corp
Bought by
Studt William John and Studt Zamie Ann
Home Financials for this Owner
Home Financials are based on the most recent Mortgage that was taken out on this home.
Original Mortgage
$52,000
Interest Rate
6.71%
Create a Home Valuation Report for This Property
The Home Valuation Report is an in-depth analysis detailing your home's value as well as a comparison with similar homes in the area
Home Values in the Area
Average Home Value in this Area
Purchase History
| Date | Buyer | Sale Price | Title Company |
|---|---|---|---|
| Garage Brian R | $750,000 | Chicago Title | |
| The Bokrus Trust | $544,900 | Heritage Title | |
| Studt William John | $254,825 | Land Title |
Source: Public Records
Mortgage History
| Date | Status | Borrower | Loan Amount |
|---|---|---|---|
| Open | Garage Brian R | $450,000 | |
| Previous Owner | Studt William John | $52,000 |
Source: Public Records
Tax History Compared to Growth
Tax History
| Year | Tax Paid | Tax Assessment Tax Assessment Total Assessment is a certain percentage of the fair market value that is determined by local assessors to be the total taxable value of land and additions on the property. | Land | Improvement |
|---|---|---|---|---|
| 2024 | $5,437 | $55,514 | $22,407 | $33,107 |
| 2023 | $5,437 | $55,514 | $22,407 | $33,107 |
| 2022 | $4,891 | $49,030 | $21,820 | $27,210 |
| 2021 | $4,953 | $50,441 | $22,448 | $27,993 |
| 2020 | $4,288 | $43,767 | $18,283 | $25,484 |
| 2019 | $4,235 | $43,767 | $18,283 | $25,484 |
| 2018 | $4,060 | $40,518 | $16,130 | $24,388 |
| 2017 | $3,705 | $40,518 | $16,130 | $24,388 |
| 2016 | $3,710 | $39,149 | $10,437 | $28,712 |
| 2015 | $3,676 | $39,149 | $10,437 | $28,712 |
| 2014 | $3,676 | $36,375 | $8,181 | $28,194 |
Source: Public Records
Map
Nearby Homes
- 12828 W Adriatic Ave
- 12807 W Adriatic Ave
- 2061 S Youngfield St
- 2164 S Zang Way
- 11904 W Auburn Dr
- 13126 W Warren Cir
- 12711 W Jewell Cir
- 2037 S Welch Cir
- 1901 S Union Place
- 2064 S Robb Way
- 11465 W Atlantic Ave
- 1847 S Union Blvd Unit 36
- 2252 S Queen St
- 1865 S Union Blvd
- 1799 S Van Gordon Ct
- 13126 W Jewell Cir
- 11165 W Asbury Ave
- 1882 S Zinnia Way
- 2703 S Cole Ct
- 2911 S Coors Dr
- 12520 W Auburn Ave
- 12540 W Auburn Ave
- 12510 W Auburn Ave
- 12550 W Auburn Ave
- 12560 W Auburn Ave
- 12574 W Iliff Ave
- 12554 W Iliff Ave
- 12624 W Iliff Ave
- 12524 W Iliff Ave
- 12490 W Auburn Ave
- 12570 W Auburn Ave
- 12644 W Iliff Ave
- 12664 W Iliff Ave
- 12480 W Auburn Ave
- 12580 W Auburn Ave
- 12573 W Iliff Ave
- 12553 W Iliff Ave
- 12623 W Iliff Ave
- 12533 W Iliff Ave
- 12684 W Iliff Ave