12538 Lakeside Pkwy Fayetteville, GA 30215
Estimated Value: $297,184 - $356,000
About This Home
Please note, our homes are available on a first-come, first-serve basis and are not reserved until the lease is signed by all applicants and security deposits are collected.
This home is priced to rent and won't be around for long. Apply now, while the current residents are preparing to move out, or call to arrange a meeting with your local Progress Residential leasing specialist today.
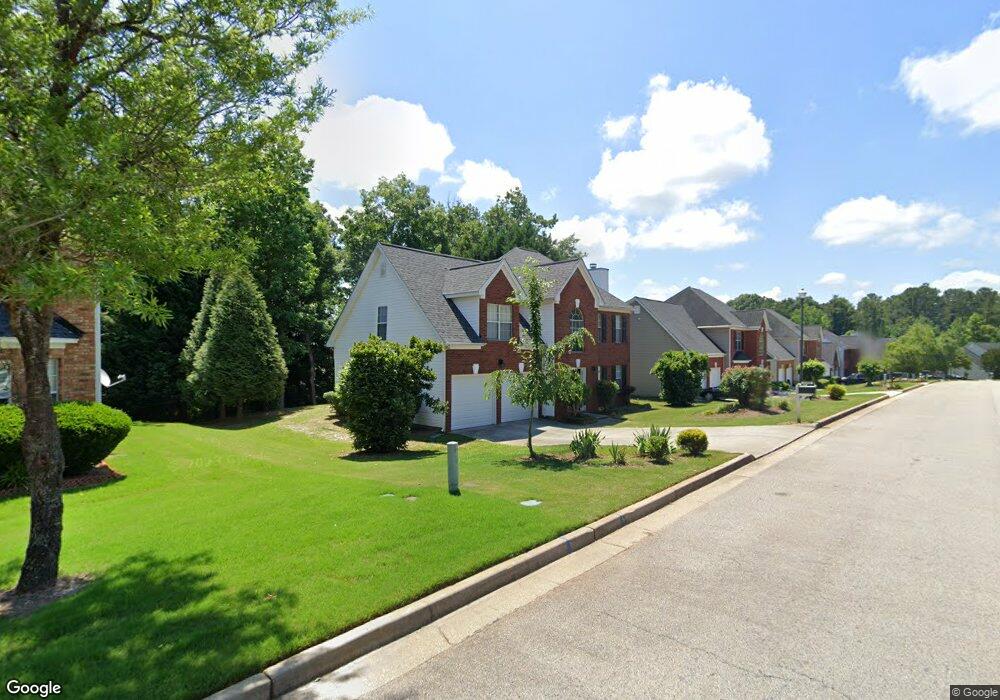
This stately red-brick rental home in Fayetteville, Georgia includes some excellent features that provide curb appeal, such as an attached two-car garage with two individual doors, a covered front porch, and beautiful landscaping. The eat-in kitchen?s built-in pantry provides ample storage space, while stainless steel appliances and durable granite countertops add a modern look. A door opens up to a cement patio in the vast backyard. Back inside, the master bedroom includes a roomy walk-in closet, a ceiling fan for extra comfort, and two windows that allow in sunlight. The attached master bathroom has a convenient walk-in shower as well as a relaxing oversized tub and two vanity sinks. Schedule a tour today.
Ownership History
Purchase Details
Purchase Details
Purchase Details
Home Financials for this Owner
Home Financials are based on the most recent Mortgage that was taken out on this home.Home Values in the Area
Average Home Value in this Area
Purchase History
| Date | Buyer | Sale Price | Title Company |
|---|---|---|---|
| Yamasa Co Ltd | $190,000 | -- | |
| Wright Dorothy Ann | -- | -- | |
| Wright Dorothy A | $136,900 | -- |
Mortgage History
| Date | Status | Borrower | Loan Amount |
|---|---|---|---|
| Previous Owner | Wright Dorothy A | $126,900 |
Property History
| Date | Event | Price | List to Sale | Price per Sq Ft |
|---|---|---|---|---|
| 12/13/2024 12/13/24 | Off Market | $2,225 | -- | -- |
| 12/07/2024 12/07/24 | Price Changed | $2,225 | -0.2% | $1 / Sq Ft |
| 12/06/2024 12/06/24 | Price Changed | $2,230 | +0.2% | $1 / Sq Ft |
| 12/05/2024 12/05/24 | Price Changed | $2,225 | -0.7% | $1 / Sq Ft |
| 12/04/2024 12/04/24 | Price Changed | $2,240 | +0.2% | $1 / Sq Ft |
| 12/03/2024 12/03/24 | Price Changed | $2,235 | +0.4% | $1 / Sq Ft |
| 11/29/2024 11/29/24 | Price Changed | $2,225 | -0.4% | $1 / Sq Ft |
| 11/26/2024 11/26/24 | Price Changed | $2,235 | -28.1% | $1 / Sq Ft |
| 11/25/2024 11/25/24 | Price Changed | $3,110 | +39.1% | $1 / Sq Ft |
| 11/24/2024 11/24/24 | Price Changed | $2,235 | +0.4% | $1 / Sq Ft |
| 11/11/2024 11/11/24 | Price Changed | $2,225 | -1.8% | $1 / Sq Ft |
| 11/10/2024 11/10/24 | Price Changed | $2,265 | +0.4% | $1 / Sq Ft |
| 11/08/2024 11/08/24 | Price Changed | $2,255 | -0.2% | $1 / Sq Ft |
| 11/07/2024 11/07/24 | Price Changed | $2,260 | -0.2% | $1 / Sq Ft |
| 11/06/2024 11/06/24 | Price Changed | $2,265 | +0.4% | $1 / Sq Ft |
| 11/05/2024 11/05/24 | Price Changed | $2,255 | -0.2% | $1 / Sq Ft |
| 11/03/2024 11/03/24 | Price Changed | $2,260 | +0.2% | $1 / Sq Ft |
| 10/31/2024 10/31/24 | Price Changed | $2,255 | -0.2% | $1 / Sq Ft |
| 10/30/2024 10/30/24 | Price Changed | $2,260 | +0.2% | $1 / Sq Ft |
| 10/27/2024 10/27/24 | Price Changed | $2,255 | -0.2% | $1 / Sq Ft |
| 10/26/2024 10/26/24 | Price Changed | $2,260 | +0.2% | $1 / Sq Ft |
| 10/22/2024 10/22/24 | Price Changed | $2,255 | -0.2% | $1 / Sq Ft |
| 10/20/2024 10/20/24 | Price Changed | $2,260 | +0.2% | $1 / Sq Ft |
| 10/19/2024 10/19/24 | Price Changed | $2,255 | -1.1% | $1 / Sq Ft |
| 10/17/2024 10/17/24 | Price Changed | $2,280 | -0.2% | $1 / Sq Ft |
| 10/15/2024 10/15/24 | Price Changed | $2,285 | +1.1% | $1 / Sq Ft |
| 10/11/2024 10/11/24 | Price Changed | $2,260 | +1.1% | $1 / Sq Ft |
| 10/11/2024 10/11/24 | For Rent | $2,235 | -- | -- |
Tax History Compared to Growth
Tax History
| Year | Tax Paid | Tax Assessment Tax Assessment Total Assessment is a certain percentage of the fair market value that is determined by local assessors to be the total taxable value of land and additions on the property. | Land | Improvement |
|---|---|---|---|---|
| 2024 | $4,610 | $117,200 | $8,800 | $108,400 |
| 2023 | $4,109 | $112,760 | $8,800 | $103,960 |
| 2022 | $3,561 | $89,760 | $8,800 | $80,960 |
| 2021 | $2,798 | $69,880 | $8,800 | $61,080 |
| 2020 | $2,858 | $70,500 | $8,800 | $61,700 |
| 2019 | $2,265 | $64,861 | $8,000 | $56,861 |
| 2018 | $2,064 | $59,899 | $8,000 | $51,899 |
| 2017 | $1,762 | $52,360 | $8,000 | $44,360 |
| 2016 | $1,669 | $50,085 | $8,000 | $42,085 |
| 2015 | $1,476 | $0 | $0 | $0 |
| 2014 | $1,419 | $34,729 | $8,000 | $26,729 |
Map
- 635 Ridgemont Dr
- 12402 Muir Field Ct
- 12350 Riviera Dr
- 12189 Lauren Way
- 12237 Cypress Ln
- 12264 Crestwood Ct
- 76 Championship Ct Unit 1
- 12225 Anchor Way
- 12238 Florin St
- 12274 Molly Sue Ln
- 12203 Crestwood Ct
- 12245 Molly Sue Ln
- 424 Hampton Rd
- 12275 Styron Dr
- 12148 Flannery Ln
- 134 Carolinas Way
- 196 Olmstead Ct Unit III
- 11977 Plantation Pkwy
- 183 Inman Rd
- 12538 Lakeside Pkwy Unit 3
- 12530 Lakeside Pkwy
- 12544 Lakeside Pkwy Unit 3
- 12522 Lakeside Pkwy
- 12537 Lakeside Pkwy Unit 3
- 12529 Lakeside Pkwy Unit 3
- 12552 Lakeside Pkwy Unit 3
- 12545 Lakeside Pkwy
- 29 Keiths Ct Unit 3
- 12521 Lakeside Pkwy Unit 124
- 12521 Lakeside Pkwy
- 0 Keiths Ct Unit 7387799
- 0 Keiths Ct Unit 7615353
- 0 Keiths Ct
- 145 Courtneys Ln
- 139 Courtneys Ln
- 12553 Lakeside Pkwy
- 151 Courtneys Ln
- 35 Keiths Ct
- 12513 Lakeside Pkwy