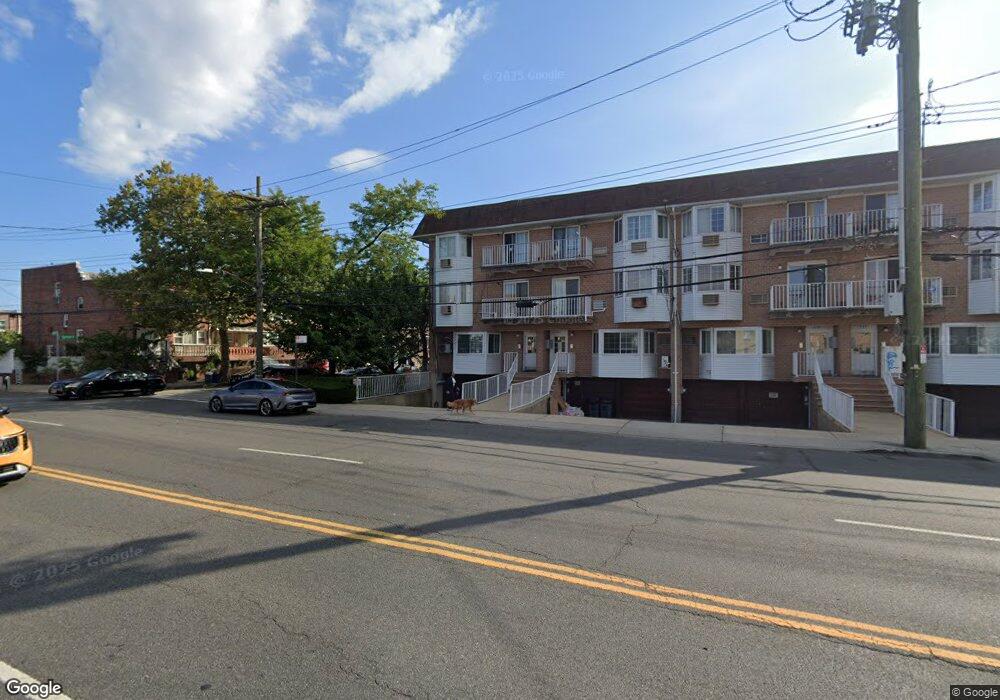
1254 E 80th St Unit 3 Brooklyn, NY 11236
Canarsie NeighborhoodEstimated Value: $443,000 - $546,000
--
Bed
--
Bath
1,065
Sq Ft
$446/Sq Ft
Est. Value
About This Home
This home is located at 1254 E 80th St Unit 3, Brooklyn, NY 11236 and is currently estimated at $474,638, approximately $445 per square foot. 1254 E 80th St Unit 3 is a home located in Kings County with nearby schools including P.S. 276 Louis Marshall, Is 68 Isaac Bildersee, and Our Lady Of Trust Catholic Accadamy.
Ownership History
Date
Name
Owned For
Owner Type
Purchase Details
Closed on
Feb 20, 2023
Sold by
Amisial Patrick and Linda Amisial As Trustee
Bought by
Amisial Patrick
Current Estimated Value
Purchase Details
Closed on
Jan 5, 2022
Sold by
Magloire Marie J
Bought by
Linda Amistial As Trustee and The Marie Jeanine Magloire Trust
Home Financials for this Owner
Home Financials are based on the most recent Mortgage that was taken out on this home.
Original Mortgage
$135,000
Outstanding Balance
$124,321
Interest Rate
3.05%
Mortgage Type
Purchase Money Mortgage
Estimated Equity
$350,317
Purchase Details
Closed on
Jan 30, 1997
Sold by
Cerchia Joseph and Cerchia Catherine
Bought by
Magloire Bertrand Louis
Home Financials for this Owner
Home Financials are based on the most recent Mortgage that was taken out on this home.
Original Mortgage
$90,000
Interest Rate
7.8%
Mortgage Type
Purchase Money Mortgage
Create a Home Valuation Report for This Property
The Home Valuation Report is an in-depth analysis detailing your home's value as well as a comparison with similar homes in the area
Home Values in the Area
Average Home Value in this Area
Purchase History
| Date | Buyer | Sale Price | Title Company |
|---|---|---|---|
| Amisial Patrick | -- | -- | |
| Linda Amistial As Trustee | -- | -- | |
| Amisial Patrick | $150,000 | -- | |
| Magloire Bertrand Louis | $150,000 | -- |
Source: Public Records
Mortgage History
| Date | Status | Borrower | Loan Amount |
|---|---|---|---|
| Open | Amisial Patrick | $135,000 | |
| Previous Owner | Magloire Bertrand Louis | $90,000 |
Source: Public Records
Tax History Compared to Growth
Tax History
| Year | Tax Paid | Tax Assessment Tax Assessment Total Assessment is a certain percentage of the fair market value that is determined by local assessors to be the total taxable value of land and additions on the property. | Land | Improvement |
|---|---|---|---|---|
| 2025 | $4,209 | $31,867 | $2,172 | $29,695 |
| 2024 | $4,209 | $25,171 | $2,172 | $22,999 |
| 2023 | $4,034 | $22,247 | $2,172 | $20,075 |
| 2022 | $3,741 | $18,741 | $2,172 | $16,569 |
| 2021 | $3,648 | $18,742 | $2,172 | $16,570 |
| 2020 | $2,736 | $17,464 | $2,172 | $15,292 |
| 2019 | $3,360 | $17,464 | $2,172 | $15,292 |
| 2018 | $3,447 | $18,370 | $2,133 | $16,237 |
| 2017 | $3,233 | $17,331 | $2,173 | $15,158 |
| 2016 | $3,099 | $17,051 | $2,220 | $14,831 |
| 2015 | $2,540 | $17,279 | $2,219 | $15,060 |
| 2014 | $2,540 | $17,280 | $2,220 | $15,060 |
Source: Public Records
Map
Nearby Homes
- 38 Paerdegat 9th St
- 28 Paerdegat 9th St
- 1253 E 80th St Unit 63
- 8103 Avenue M Unit 35
- 17 E 17th St Unit B3
- 1306 E 83rd St Unit 303
- 1306 E 83rd St Unit 204
- 1306 E 83rd St Unit 202
- 1306 E 83rd St Unit 302
- 1222 E 83rd St
- 2 Paerdegat 11th St
- 1248 E 84th St
- 1307 E 84th St Unit 3A
- 1307 E 84th St Unit 3B
- 1307 E 84th St Unit 3D
- 1307 E 84th St Unit 2B
- 1307 E 84th St Unit 3C
- 1307 E 84th St Unit 1D
- 1307 E 84th St Unit 1A
- 1204 E 84th St
- 1254 E 80th St Unit 4
- 1254 E 80th St Unit 2
- 1254 E 80th St Unit 1
- 1254 E 80th St
- 1250 E 80th St Unit 8
- 1250 E 80th St Unit 7
- 1250 E 80th St Unit 6
- 1250 E 80th St Unit 5
- 1250 E 80th St
- 1250 E 80th St Unit G4
- 1250 E 80th St Unit G3
- 1248 E 80th St Unit 12
- 1248 E 80th St Unit 11
- 1248 E 80th St Unit 10
- 1248 E 80th St Unit 9
- 1248 E 80th St Unit G6
- 1244 E 80th St Unit 16
- 1244 E 80th St Unit 15
- 1244 E 80th St Unit 14
- 1244 E 80th St Unit 13