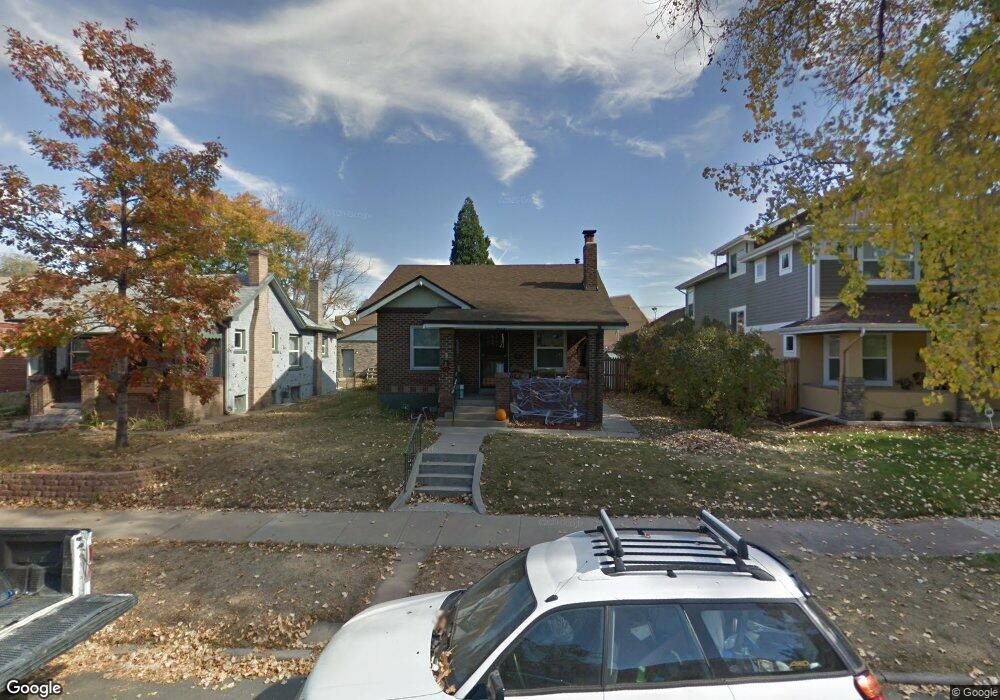
1254 S Sherman St Denver, CO 80210
Platt Park NeighborhoodEstimated Value: $762,000 - $828,000
3
Beds
2
Baths
1,600
Sq Ft
$493/Sq Ft
Est. Value
About This Home
This home is located at 1254 S Sherman St, Denver, CO 80210 and is currently estimated at $788,797, approximately $492 per square foot. 1254 S Sherman St is a home located in Denver County with nearby schools including McKinley-Thatcher Elementary School, Grant Beacon Middle School, and South High School.
Ownership History
Date
Name
Owned For
Owner Type
Purchase Details
Closed on
Sep 10, 2020
Sold by
Alarita Properties Llc
Bought by
Hunter Allison
Current Estimated Value
Purchase Details
Closed on
Mar 19, 2019
Sold by
Hunter Allison
Bought by
Co 1254 Llc
Purchase Details
Closed on
Jun 27, 2011
Sold by
Willins Stanton S and Losh Maren
Bought by
Hunter Allison
Purchase Details
Closed on
Jul 1, 2003
Sold by
Holtz Herman
Bought by
Willins Stanton S and Losh Maren
Home Financials for this Owner
Home Financials are based on the most recent Mortgage that was taken out on this home.
Original Mortgage
$208,400
Interest Rate
3.75%
Mortgage Type
Purchase Money Mortgage
Purchase Details
Closed on
Jan 2, 2003
Sold by
Holtz Herman
Bought by
Holtz Herman
Create a Home Valuation Report for This Property
The Home Valuation Report is an in-depth analysis detailing your home's value as well as a comparison with similar homes in the area
Home Values in the Area
Average Home Value in this Area
Purchase History
| Date | Buyer | Sale Price | Title Company |
|---|---|---|---|
| Hunter Allison | -- | None Available | |
| Alarita Properties Llc | -- | None Available | |
| Co 1254 Llc | -- | None Available | |
| Hunter Allison | $304,000 | Heritage Title | |
| Willins Stanton S | $260,500 | Stewart Title | |
| Holtz Herman | -- | Stewart Title | |
| Holtz Herman | -- | -- |
Source: Public Records
Mortgage History
| Date | Status | Borrower | Loan Amount |
|---|---|---|---|
| Previous Owner | Willins Stanton S | $208,400 |
Source: Public Records
Tax History Compared to Growth
Tax History
| Year | Tax Paid | Tax Assessment Tax Assessment Total Assessment is a certain percentage of the fair market value that is determined by local assessors to be the total taxable value of land and additions on the property. | Land | Improvement |
|---|---|---|---|---|
| 2024 | $4,038 | $50,980 | $40,010 | $10,970 |
| 2023 | $3,950 | $50,980 | $40,010 | $10,970 |
| 2022 | $3,554 | $44,690 | $37,770 | $6,920 |
| 2021 | $3,430 | $45,970 | $38,860 | $7,110 |
| 2020 | $3,207 | $43,220 | $31,090 | $12,130 |
| 2019 | $3,117 | $43,220 | $31,090 | $12,130 |
| 2018 | $2,698 | $34,870 | $26,420 | $8,450 |
| 2017 | $2,690 | $34,870 | $26,420 | $8,450 |
| 2016 | $2,672 | $32,770 | $18,388 | $14,382 |
| 2015 | $2,560 | $32,770 | $18,388 | $14,382 |
| 2014 | $2,032 | $24,470 | $13,484 | $10,986 |
Source: Public Records
Map
Nearby Homes
- 1209 S Pennsylvania St
- 1355 S Pennsylvania St
- 1518 S Sherman St
- 1056 S Pennsylvania St
- 1144 S Cherokee St
- 1001 S Pennsylvania St Unit 1005
- 1313 S Clarkson St Unit 305
- 1313 S Clarkson St Unit 405
- 1313 S Clarkson St Unit 202
- 969 S Pearl St Unit 204
- 1260 S Emerson St
- 1626 S Sherman St
- 838 S Sherman St
- 1127 S Ogden St
- 1023 S Emerson St
- 1650 S Pennsylvania St
- 130 E Ohio Ave Unit 140
- 2121 S Galapago St
- 1050 S Corona St
- 794 S Pearl St
- 1260 S Sherman St
- 1248 S Sherman St
- 1242 S Sherman St
- 1270 S Sherman St
- 1236 S Sherman St
- 1255 S Sherman St
- 1276 S Sherman St
- 1259 S Sherman St
- 1253 S Sherman St
- 1265 S Sherman St
- 1230 S Sherman St
- 1249 S Sherman St
- 1263 S Sherman St
- 1271 S Sherman St
- 1239 S Sherman St
- 1222 S Sherman St
- 1229 S Sherman St
- 1220 S Sherman St
- 1218 S Sherman St Unit 1220
- 1277 S Sherman St