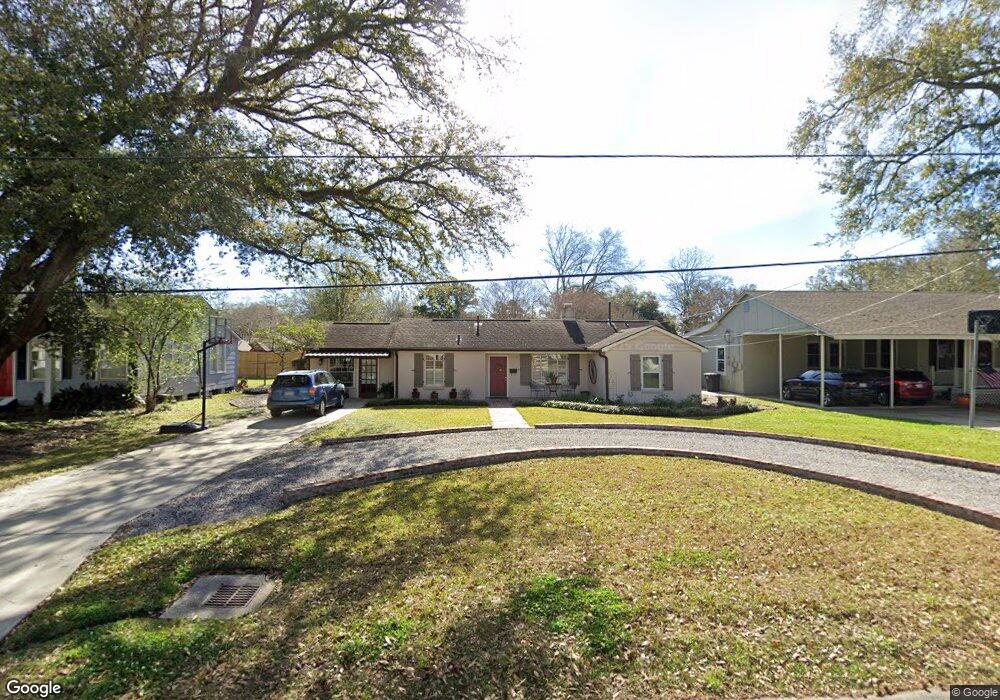
1254 Stephens Ave Baton Rouge, LA 70808
Highlands/Perkins NeighborhoodEstimated Value: $383,000 - $488,000
3
Beds
3
Baths
2,152
Sq Ft
$193/Sq Ft
Est. Value
About This Home
This home is located at 1254 Stephens Ave, Baton Rouge, LA 70808 and is currently estimated at $416,167, approximately $193 per square foot. 1254 Stephens Ave is a home located in East Baton Rouge Parish with nearby schools including Buchanan Elementary School, Glasgow Middle School, and Mckinley Senior High School.
Ownership History
Date
Name
Owned For
Owner Type
Purchase Details
Closed on
Apr 4, 2006
Sold by
Dussouy Gary D
Bought by
Slack Timothy A and Rizzuto,Tracey E
Current Estimated Value
Home Financials for this Owner
Home Financials are based on the most recent Mortgage that was taken out on this home.
Original Mortgage
$234,150
Outstanding Balance
$133,390
Interest Rate
6.21%
Mortgage Type
New Conventional
Estimated Equity
$282,777
Purchase Details
Closed on
Sep 26, 2005
Sold by
Montgomery Steven M
Bought by
Dussouy Gary D
Home Financials for this Owner
Home Financials are based on the most recent Mortgage that was taken out on this home.
Original Mortgage
$244,000
Interest Rate
5.88%
Mortgage Type
New Conventional
Purchase Details
Closed on
Mar 29, 1999
Sold by
Lewis Lewis Jason Aaron
Bought by
Mullen Brinson Jr Edward Bailey and Mullen Brinson Mary
Home Financials for this Owner
Home Financials are based on the most recent Mortgage that was taken out on this home.
Original Mortgage
$124,000
Interest Rate
6.91%
Create a Home Valuation Report for This Property
The Home Valuation Report is an in-depth analysis detailing your home's value as well as a comparison with similar homes in the area
Home Values in the Area
Average Home Value in this Area
Purchase History
| Date | Buyer | Sale Price | Title Company |
|---|---|---|---|
| Slack Timothy A | $246,500 | -- | |
| Dussouy Gary D | $244,000 | -- | |
| Mullen Brinson Jr Edward Bailey | $155,000 | -- |
Source: Public Records
Mortgage History
| Date | Status | Borrower | Loan Amount |
|---|---|---|---|
| Open | Slack Timothy A | $234,150 | |
| Previous Owner | Dussouy Gary D | $244,000 | |
| Previous Owner | Mullen Brinson Jr Edward Bailey | $124,000 |
Source: Public Records
Tax History Compared to Growth
Tax History
| Year | Tax Paid | Tax Assessment Tax Assessment Total Assessment is a certain percentage of the fair market value that is determined by local assessors to be the total taxable value of land and additions on the property. | Land | Improvement |
|---|---|---|---|---|
| 2024 | $2,950 | $31,920 | $1,500 | $30,420 |
| 2023 | $2,950 | $30,600 | $1,500 | $29,100 |
| 2022 | $3,654 | $30,600 | $1,500 | $29,100 |
| 2021 | $3,570 | $30,600 | $1,500 | $29,100 |
| 2020 | $3,547 | $30,600 | $1,500 | $29,100 |
| 2019 | $3,222 | $26,600 | $1,500 | $25,100 |
| 2018 | $3,182 | $26,600 | $1,500 | $25,100 |
| 2017 | $3,182 | $26,600 | $1,500 | $25,100 |
| 2016 | $2,325 | $26,600 | $1,500 | $25,100 |
| 2015 | $2,100 | $24,650 | $1,500 | $23,150 |
| 2014 | $2,093 | $24,650 | $1,500 | $23,150 |
| 2013 | -- | $24,650 | $1,500 | $23,150 |
Source: Public Records
Map
Nearby Homes
- 4126 Floyd Dr
- 3730 Floyd Dr
- 1505 Stuart Ave
- 4328 Cypress St
- 1525 Hood Ave
- 1421 Pickett Ave
- 4013 Hyacinth Ave
- 3616 S Lakeshore Dr
- 1227 Lee Dr
- 998 Stanford Ave Unit 311
- 998 Stanford Ave Unit 206
- 998 Stanford Ave Unit 303
- 998 Stanford Ave Unit 402
- 998 Stanford Ave Unit 211
- 998 Stanford Ave Unit 407
- 998 Stanford Ave Unit 201
- 4492 Hyacinth Ave
- 990 Stanford Ave Unit 207
- 1509 Stanford Ave Unit A3
- 4518 Hyacinth Ave
- 1266 Stephens Ave
- 1246 Stephens Ave
- 1263 Aberdeen Ave
- 1234 Stephens Ave
- 1304 Stephens Ave
- 1255 Aberdeen Ave
- 1267 Aberdeen Ave
- 1255 Stephens Ave
- 1265 Stephens Ave
- 1247 Aberdeen Ave
- 1303 Aberdeen Ave
- 1245 Stephens Ave
- 1226 Stephens Ave
- 1320 Stephens Ave
- 1307 Stephens Ave
- 1233 Stephens Ave
- 1235 Aberdeen Ave
- 1313 Aberdeen Ave
- 1321 Stephens Ave
- 1225 Stephens Ave