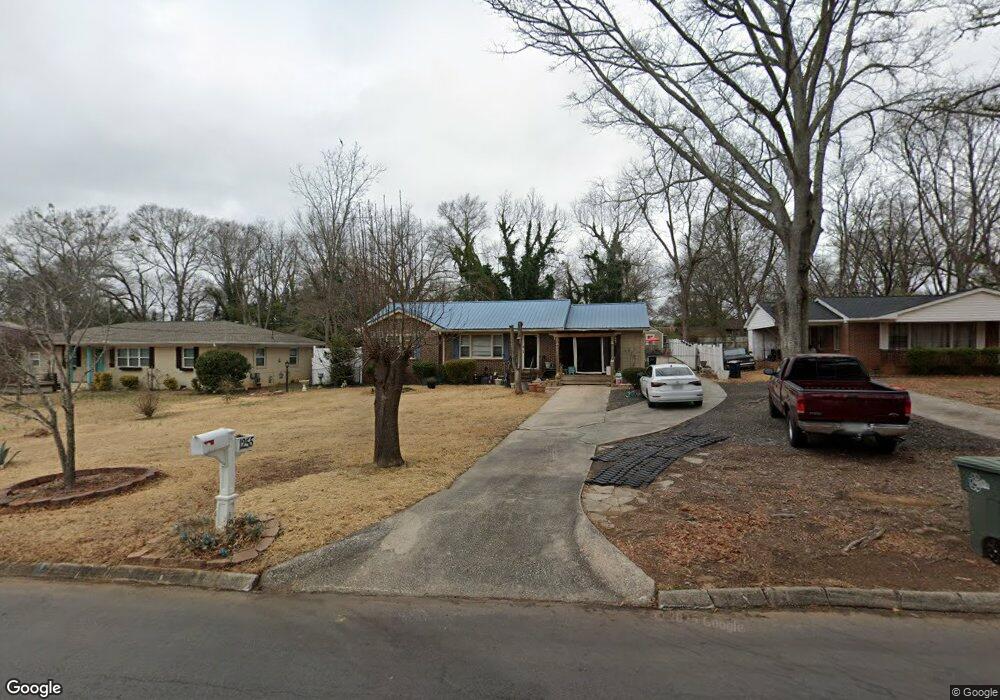
1255 Cherokee Ave Griffin, GA 30224
Spalding County NeighborhoodEstimated Value: $165,000 - $173,000
3
Beds
2
Baths
1,360
Sq Ft
$124/Sq Ft
Est. Value
About This Home
This home is located at 1255 Cherokee Ave, Griffin, GA 30224 and is currently estimated at $169,319, approximately $124 per square foot. 1255 Cherokee Ave is a home located in Spalding County with nearby schools including Anne Street Elementary School, Rehoboth Road Middle School, and Griffin High School.
Ownership History
Date
Name
Owned For
Owner Type
Purchase Details
Closed on
Jun 10, 1998
Sold by
Johnson Betty S
Bought by
Giddens Joann
Current Estimated Value
Home Financials for this Owner
Home Financials are based on the most recent Mortgage that was taken out on this home.
Original Mortgage
$75,000
Outstanding Balance
$15,239
Interest Rate
7.23%
Mortgage Type
New Conventional
Estimated Equity
$154,080
Purchase Details
Closed on
Sep 3, 1992
Sold by
Nichols Nichols L and Nichols Bessie
Bought by
Johnson Betty S
Purchase Details
Closed on
Apr 20, 1990
Sold by
Hardy Robert B and Hardy Bera B
Bought by
Nichols Nichols L and Nichols Bessie
Purchase Details
Closed on
Feb 1, 1989
Sold by
Powers Marvin T
Bought by
Hardy Robert B and Hardy Bera B
Purchase Details
Closed on
Jan 17, 1967
Sold by
Slater James T
Bought by
Powers Marvin T
Purchase Details
Closed on
Oct 4, 1966
Sold by
Moore Lewis R
Bought by
Slater James T
Purchase Details
Closed on
May 12, 1961
Bought by
Moore Lewis R
Create a Home Valuation Report for This Property
The Home Valuation Report is an in-depth analysis detailing your home's value as well as a comparison with similar homes in the area
Home Values in the Area
Average Home Value in this Area
Purchase History
| Date | Buyer | Sale Price | Title Company |
|---|---|---|---|
| Giddens Joann | $79,000 | -- | |
| Johnson Betty S | $50,000 | -- | |
| Nichols Nichols L | $59,900 | -- | |
| Hardy Robert B | $46,000 | -- | |
| Powers Marvin T | $1,100 | -- | |
| Slater James T | $17,100 | -- | |
| Moore Lewis R | $14,900 | -- |
Source: Public Records
Mortgage History
| Date | Status | Borrower | Loan Amount |
|---|---|---|---|
| Open | Giddens Joann | $75,000 |
Source: Public Records
Tax History Compared to Growth
Tax History
| Year | Tax Paid | Tax Assessment Tax Assessment Total Assessment is a certain percentage of the fair market value that is determined by local assessors to be the total taxable value of land and additions on the property. | Land | Improvement |
|---|---|---|---|---|
| 2024 | $1,685 | $46,438 | $4,800 | $41,638 |
| 2023 | $1,685 | $44,888 | $4,800 | $40,088 |
| 2022 | $1,466 | $39,031 | $4,000 | $35,031 |
| 2021 | $1,132 | $30,680 | $4,000 | $26,680 |
| 2020 | $766 | $21,520 | $4,000 | $17,520 |
| 2019 | $780 | $21,520 | $4,000 | $17,520 |
| 2018 | $747 | $20,048 | $4,000 | $16,048 |
| 2017 | $730 | $20,048 | $4,000 | $16,048 |
| 2016 | $742 | $20,048 | $4,000 | $16,048 |
| 2015 | $695 | $18,647 | $4,000 | $14,647 |
| 2014 | $715 | $18,647 | $4,000 | $14,647 |
Source: Public Records
Map
Nearby Homes
- 1264 Cherokee Ave
- 309 Cherokee Cir
- 1313 D F Fuller Dr
- 305 S 18th St
- 1228-1328 Edgewood Ave
- 1054 W College Street Extension
- 915 W Poplar St
- 141 North Expy
- 1022 Beck St
- 203 Hillside Cir
- 717 Scales St
- 1326 Oakdale Dr
- 1206 Hillwood Ave
- 731 Scales St
- 1223 W Broad St
- 1126 Wright St
- 1025 W Broad St
- 930 W Broad St
- 1106 Wright St
- 1017 W Broad St
- 1259 Cherokee Ave
- 1251 Cherokee Ave
- 0 Cherokee Ave Unit 7201846
- 0 Cherokee Ave Unit 7127540
- 0 Cherokee Ave Unit 7564369
- 0 Cherokee Ave Unit 8510539
- 0 Cherokee Ave Unit 8133976
- 0 Cherokee Ave Unit 8480717
- 0 Cherokee Ave Unit 7542495
- 0 Cherokee Ave Unit 9034713
- 0 Cherokee Ave Unit 9030398
- 0 Cherokee Ave Unit 8839338
- 0 Cherokee Ave Unit 8862012
- 0 Cherokee Ave Unit 8907885
- 0 Cherokee Ave Unit 3235090
- 0 Cherokee Ave
- 1247 Cherokee Ave
- 1261 Cherokee Ave
- 1254 Cherokee Ave
- 1313 N Cherokee Ave