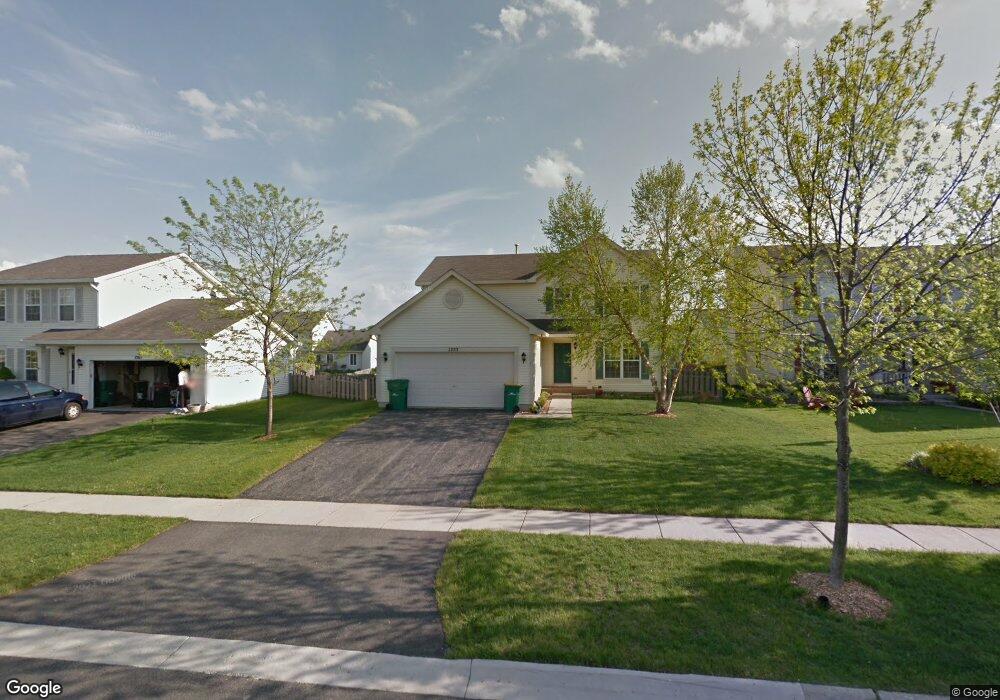
1255 E Greystone Dr Round Lake Beach, IL 60073
Estimated Value: $351,869 - $369,000
3
Beds
3
Baths
1,797
Sq Ft
$200/Sq Ft
Est. Value
About This Home
This home is located at 1255 E Greystone Dr, Round Lake Beach, IL 60073 and is currently estimated at $359,467, approximately $200 per square foot. 1255 E Greystone Dr is a home located in Lake County with nearby schools including Avon Center Elementary School, Frederick School, and Grayslake Middle School.
Ownership History
Date
Name
Owned For
Owner Type
Purchase Details
Closed on
Sep 5, 2008
Sold by
Prudential Relocation Inc
Bought by
Moormeier Josh and Moormeier Romi S
Current Estimated Value
Home Financials for this Owner
Home Financials are based on the most recent Mortgage that was taken out on this home.
Original Mortgage
$179,792
Interest Rate
4.83%
Mortgage Type
FHA
Purchase Details
Closed on
Jun 6, 2008
Sold by
Klein Harris I and Klein Ruth A
Bought by
Prudential Relocation Inc
Purchase Details
Closed on
Nov 29, 2001
Sold by
Wixted Thomas W
Bought by
Klein Harris I and Klein Ruth A
Home Financials for this Owner
Home Financials are based on the most recent Mortgage that was taken out on this home.
Original Mortgage
$149,200
Interest Rate
7.07%
Purchase Details
Closed on
May 3, 2000
Sold by
Lakewood Hills Llc
Bought by
Wixted Thomas W
Create a Home Valuation Report for This Property
The Home Valuation Report is an in-depth analysis detailing your home's value as well as a comparison with similar homes in the area
Home Values in the Area
Average Home Value in this Area
Purchase History
We collect this data history from publicly available records. To have your information removed, we recommend requesting removal directly through your county’s website.
| Date | Buyer | Sale Price | Title Company |
|---|---|---|---|
| Moormeier Josh | $186,000 | Ticor | |
| Prudential Relocation Inc | $186,000 | None Available | |
| Klein Harris I | $186,500 | -- | |
| Wixted Thomas W | $189,000 | -- |
Source: Public Records
Mortgage History
We collect this data history from publicly available records. To have your information removed, we recommend requesting removal directly through your county’s website.
| Date | Status | Borrower | Loan Amount |
|---|---|---|---|
| Previous Owner | Moormeier Josh | $179,792 | |
| Previous Owner | Klein Harris I | $149,200 |
Source: Public Records
Tax History
| Year | Tax Paid | Tax Assessment Tax Assessment Total Assessment is a certain percentage of the fair market value that is determined by local assessors to be the total taxable value of land and additions on the property. | Land | Improvement |
|---|---|---|---|---|
| 2025 | $10,772 | $106,253 | $16,228 | $90,025 |
| 2024 | $9,924 | $99,052 | $15,128 | $83,924 |
| 2023 | $8,793 | $87,517 | $13,366 | $74,151 |
| 2022 | $8,793 | $74,884 | $10,805 | $64,079 |
| 2021 | $8,434 | $69,562 | $10,037 | $59,525 |
| 2020 | $8,593 | $67,333 | $9,715 | $57,618 |
| 2019 | $8,320 | $64,712 | $9,337 | $55,375 |
| 2018 | $8,386 | $63,674 | $12,987 | $50,687 |
| 2017 | $8,441 | $61,976 | $12,641 | $49,335 |
| 2016 | $8,390 | $59,466 | $12,129 | $47,337 |
| 2015 | $8,341 | $55,539 | $11,328 | $44,211 |
| 2014 | $8,004 | $55,534 | $10,749 | $44,785 |
| 2012 | $7,342 | $55,802 | $10,801 | $45,001 |
Source: Public Records
Map
Nearby Homes
- 1327 E Fox Chase Dr
- 1263 E Essex Ct
- 264 Crozier Dr
- 250 Crozier Dr
- 2814 Phillip Dr
- 2755 Sheldon Rd
- 974 Deer Trail
- 2212 Oak Leaf Ct
- 21564 W Sarah Dr
- 21437 W Engle Dr
- 909 Fox Chase Dr
- 211 Frances Dr
- 21290 W Engle Dr
- 864 Fox Chase Dr
- 36855 N Elizabeth Dr
- 2011 Oak Tree Trail
- 21339 W Morton Dr
- 36812 N Helen Dr
- 36912 N Lawrence Dr
- 37073 N Antonio Ave
- 1245 E Greystone Dr
- 1265 E Greystone Dr Unit 1
- 1260 E Komar Ln
- 1250 E Komar Ln
- 1281 E Greystone Dr
- 1240 E Komar Ln
- 1274 E Komar Ln Unit 1
- 1229 E Greystone Dr Unit 1
- 1260 E Greystone Dr
- 1250 E Greystone Dr
- 1230 E Komar Ln
- 1268 E Greystone Dr Unit 1
- 1291 E Greystone Dr
- 1242 E Greystone Dr Unit 1
- 1276 E Greystone Dr
- 1234 E Greystone Dr
- 1219 E Greystone Dr
- 1224 E Komar Ln
- 1284 E Greystone Dr Unit 1
- 2402 N Greystone Dr
Your Personal Tour Guide
Ask me questions while you tour the home.