Estimated Value: $188,000 - $275,000
3
Beds
2
Baths
1,584
Sq Ft
$139/Sq Ft
Est. Value
About This Home
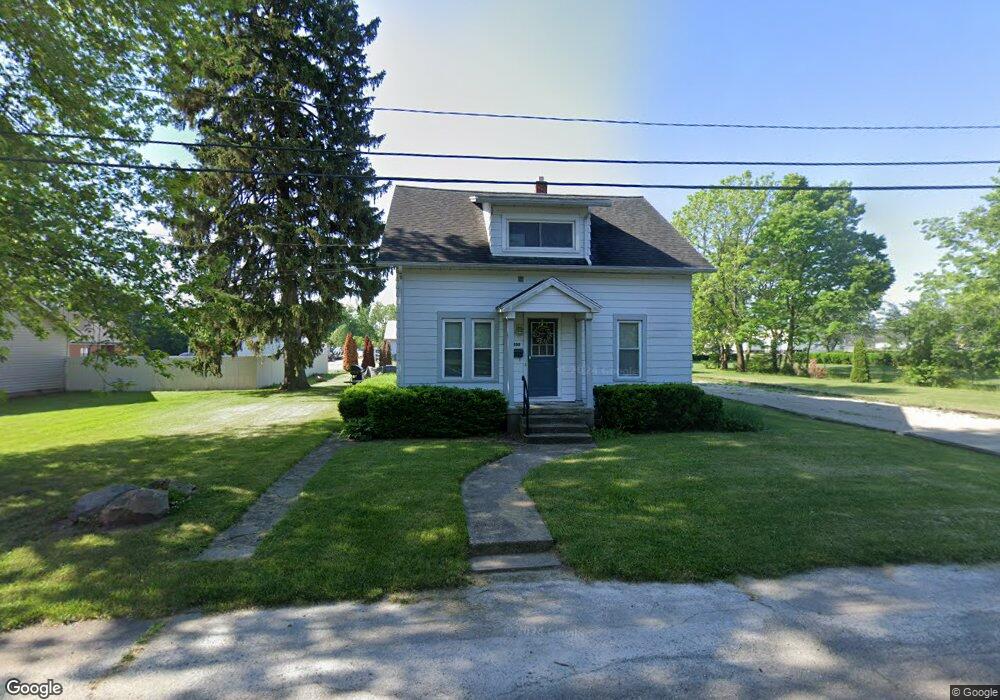
This home is located at 1255 High St, Troy, OH 45373 and is currently estimated at $219,576, approximately $138 per square foot. 1255 High St is a home located in Miami County with nearby schools including Heywood Elementary School, Van Cleve Elementary School, and Troy Junior High School.
Ownership History
Date
Name
Owned For
Owner Type
Purchase Details
Closed on
Jul 21, 2021
Sold by
Summers Paul L and Summers Barbara E
Bought by
Hipoint Properties Llc
Current Estimated Value
Purchase Details
Closed on
May 13, 2021
Sold by
Ellicott May Keller
Bought by
Summers Paul L and Summers Barbara E
Home Financials for this Owner
Home Financials are based on the most recent Mortgage that was taken out on this home.
Original Mortgage
$96,000
Interest Rate
2.9%
Mortgage Type
New Conventional
Purchase Details
Closed on
Feb 16, 2007
Sold by
Ellicott May Keller and Ellicott Lyle H
Bought by
Ellicott May Keller
Purchase Details
Closed on
Apr 15, 1999
Sold by
Frazier Gina M
Bought by
Ellicot May Keller and Ellicott Lyle H
Purchase Details
Closed on
May 2, 1991
Bought by
Frazier Jerry L
Create a Home Valuation Report for This Property
The Home Valuation Report is an in-depth analysis detailing your home's value as well as a comparison with similar homes in the area
Home Values in the Area
Average Home Value in this Area
Purchase History
| Date | Buyer | Sale Price | Title Company |
|---|---|---|---|
| Hipoint Properties Llc | -- | None Available | |
| Summers Paul L | $128,000 | None Available | |
| Summers Paul L | -- | None Listed On Document | |
| Ellicott May Keller | -- | -- | |
| Ellicot May Keller | $65,000 | -- | |
| Frazier Jerry L | $52,900 | -- |
Source: Public Records
Mortgage History
| Date | Status | Borrower | Loan Amount |
|---|---|---|---|
| Previous Owner | Summers Paul L | $96,000 | |
| Closed | Ellicot May Keller | -- |
Source: Public Records
Tax History
| Year | Tax Paid | Tax Assessment Tax Assessment Total Assessment is a certain percentage of the fair market value that is determined by local assessors to be the total taxable value of land and additions on the property. | Land | Improvement |
|---|---|---|---|---|
| 2024 | $2,039 | $45,190 | $16,800 | $28,390 |
| 2023 | $1,742 | $45,190 | $16,800 | $28,390 |
| 2022 | $1,458 | $45,190 | $16,800 | $28,390 |
| 2021 | $1,228 | $36,160 | $13,440 | $22,720 |
| 2020 | $1,230 | $36,160 | $13,440 | $22,720 |
| 2019 | $1,241 | $36,160 | $13,440 | $22,720 |
| 2018 | $1,106 | $30,980 | $12,780 | $18,200 |
| 2017 | $1,118 | $30,980 | $12,780 | $18,200 |
| 2016 | $1,102 | $30,980 | $12,780 | $18,200 |
| 2015 | $1,210 | $32,590 | $13,440 | $19,150 |
| 2014 | $1,210 | $32,590 | $13,440 | $19,150 |
| 2013 | $1,218 | $32,590 | $13,440 | $19,150 |
Source: Public Records
Map
Nearby Homes
- 1141 Dickerson Dr
- 385 W Ross St
- 1201 Maple St
- 1426 Paul Revere Way Unit B
- 1426 Paul Revere Way Unit D
- 920 Old Nursery Trail
- 1481 Lantern Ln
- 1479 Lantern Ln Unit 1479
- 1212 Spruce St
- 410 Armand Dr
- 405 Lake St
- 510 Drury Ln
- 00 W
- 712 S Clay St
- 517 S Cherry St
- 504 S Market St
- 1610 Creekwood Dr
- 302 Pennsylvania Ave
- 408 S Market St
- 339 Lincoln Ave
- 1215 High St
- 1205 High St
- 1210 High St
- 1224 High St
- 1202 Peters Rd
- 9999 Peters Ave
- 1102 Peters Rd
- 1105 Peters Rd
- 1103 Peters Rd
- 1101 Peters Rd
- 1118 Arborvitae Cir
- 1120 Arborvitae Cir
- 1262 Peters Rd
- 1121 Arborvitae Cir
- 714 Old Newton Pike
- 702 Old Newton Pike
- 650 Old Newton Pike
- 722 Old Newton Pike
- 1114 Arborvitae Cir
- 1119 Arborvitae Cir
Your Personal Tour Guide
Ask me questions while you tour the home.