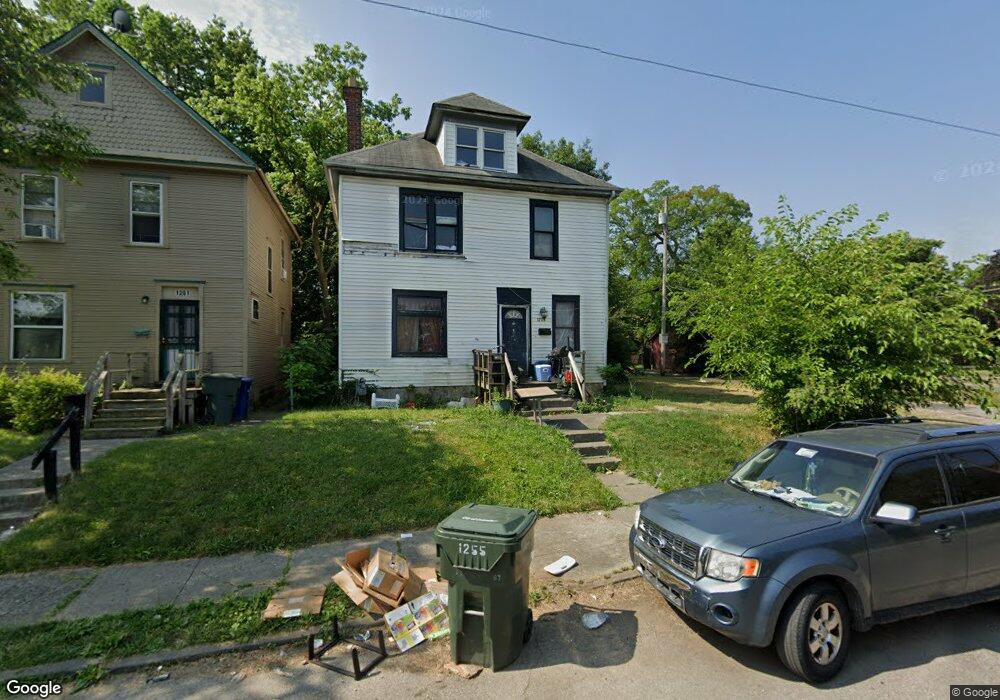
1255 Mooberry St Columbus, OH 43205
Livingston Park NeighborhoodEstimated Value: $247,105 - $295,000
4
Beds
1
Bath
1,616
Sq Ft
$165/Sq Ft
Est. Value
About This Home
This home is located at 1255 Mooberry St, Columbus, OH 43205 and is currently estimated at $267,026, approximately $165 per square foot. 1255 Mooberry St is a home located in Franklin County with nearby schools including Livingston Elementary School, South High School, and Capital Collegiate Preparatory Academy.
Ownership History
Date
Name
Owned For
Owner Type
Purchase Details
Closed on
Jan 18, 2001
Sold by
Lilley Joey
Bought by
Lawson Larry and Lawson Lamontica
Current Estimated Value
Home Financials for this Owner
Home Financials are based on the most recent Mortgage that was taken out on this home.
Original Mortgage
$57,600
Outstanding Balance
$24,920
Interest Rate
9.95%
Estimated Equity
$242,106
Purchase Details
Closed on
Apr 27, 1999
Sold by
Smonette Sybert Ltd
Bought by
Lilley Joey
Home Financials for this Owner
Home Financials are based on the most recent Mortgage that was taken out on this home.
Original Mortgage
$49,000
Interest Rate
7.05%
Purchase Details
Closed on
Feb 22, 1999
Sold by
Bankers Trust Company
Bought by
Simonette Sybert Ltd
Purchase Details
Closed on
Nov 19, 1998
Sold by
Brown Stephen E and Case #97Cve05-5427
Bought by
Bankers Trust Company
Purchase Details
Closed on
Dec 22, 1994
Sold by
Smith Brian J
Bought by
Brown Janice and Brown Stephen H
Purchase Details
Closed on
Jun 4, 1991
Purchase Details
Closed on
May 2, 1991
Create a Home Valuation Report for This Property
The Home Valuation Report is an in-depth analysis detailing your home's value as well as a comparison with similar homes in the area
Home Values in the Area
Average Home Value in this Area
Purchase History
| Date | Buyer | Sale Price | Title Company |
|---|---|---|---|
| Lawson Larry | $72,000 | Christopher Land Title Inc | |
| Lilley Joey | $70,000 | Peterson Title Agency | |
| Simonette Sybert Ltd | $16,000 | Advantage One Title Agency I | |
| Bankers Trust Company | $22,000 | -- | |
| Brown Janice | $46,000 | -- | |
| -- | $45,000 | -- | |
| -- | $10,000 | -- |
Source: Public Records
Mortgage History
| Date | Status | Borrower | Loan Amount |
|---|---|---|---|
| Open | Lawson Larry | $57,600 | |
| Previous Owner | Lilley Joey | $49,000 | |
| Closed | Lawson Larry | $14,400 |
Source: Public Records
Tax History Compared to Growth
Tax History
| Year | Tax Paid | Tax Assessment Tax Assessment Total Assessment is a certain percentage of the fair market value that is determined by local assessors to be the total taxable value of land and additions on the property. | Land | Improvement |
|---|---|---|---|---|
| 2024 | $3,571 | $77,390 | $30,210 | $47,180 |
| 2023 | $3,429 | $77,385 | $30,205 | $47,180 |
| 2022 | $1,527 | $29,440 | $5,220 | $24,220 |
| 2021 | $1,530 | $29,440 | $5,220 | $24,220 |
| 2020 | $1,532 | $29,440 | $5,220 | $24,220 |
| 2019 | $1,374 | $22,650 | $4,030 | $18,620 |
| 2018 | $1,151 | $22,650 | $4,030 | $18,620 |
| 2017 | $1,133 | $22,650 | $4,030 | $18,620 |
| 2016 | $893 | $13,480 | $3,780 | $9,700 |
| 2015 | $931 | $13,480 | $3,780 | $9,700 |
| 2014 | $813 | $13,480 | $3,780 | $9,700 |
| 2013 | $422 | $14,210 | $3,990 | $10,220 |
Source: Public Records
Map
Nearby Homes
- 664-666 Bedford Ave
- 0 Mooberry St
- 1328 Kent St
- 572 Linwood Ave
- 668 Wilson Ave
- 555 Kimball Place Unit 557
- 568-570 Kimball Place
- 734 Linwood Ave
- 532 Linwood Ave Unit 34
- 1356 Cole St
- 0 E Fulton St
- 1364 E Fulton St Unit 366
- 730 Miller Ave
- 1186-1188 E Livingston Ave Unit 1186
- 778 Miller Ave
- 1225 E Livingston Ave
- 829-831 Studer Ave
- 1119 E Fulton St
- 1157 E Livingston Ave
- 693 Kelton Ave
- 1261 Mooberry St
- 1265 Mooberry St
- 1269 Mooberry St
- 661 Bedford Ave
- 632 Linwood Ave
- 642 Linwood Ave
- 1272 Kent St
- 1275 Mooberry St
- 665 Bedford Ave
- 650 Linwood Ave
- 640 Linwood Ave Unit 2
- 640 Linwood Ave
- 669 Bedford Ave
- 652 Linwood Ave
- 1277 Mooberry St
- 1277 Mooberry St Unit 279
- 1279 Mooberry St
- 1279 Mooberry St Unit 81
- 658 Linwood Ave
- 673 Bedford Ave