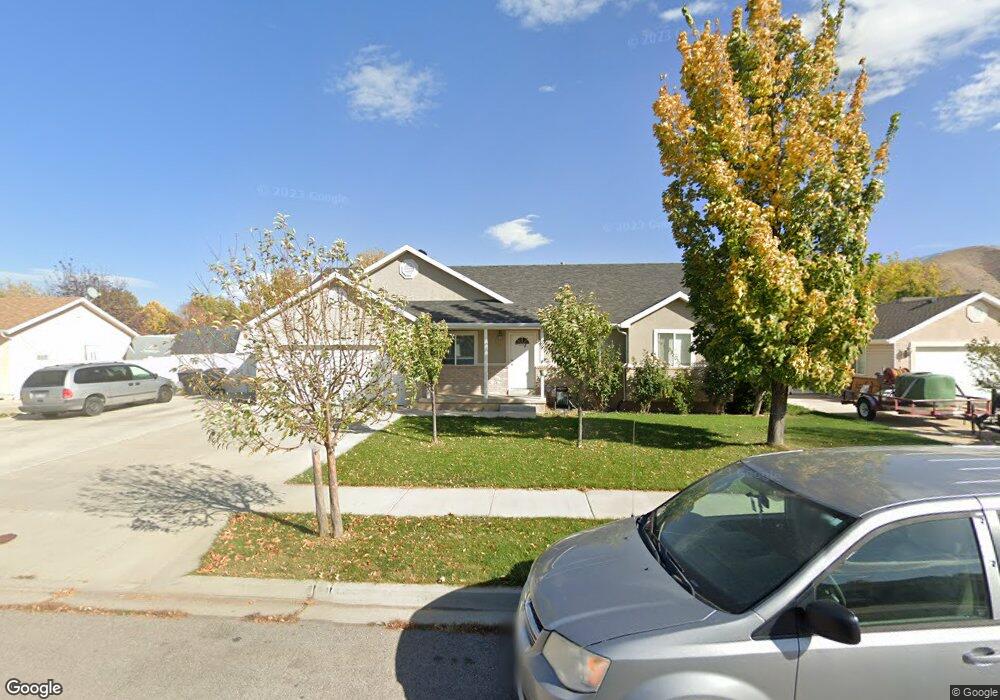
1255 S 400 W Payson, UT 84651
Estimated Value: $545,000 - $583,000
6
Beds
3
Baths
3,070
Sq Ft
$182/Sq Ft
Est. Value
About This Home
This home is located at 1255 S 400 W, Payson, UT 84651 and is currently estimated at $560,262, approximately $182 per square foot. 1255 S 400 W is a home located in Utah County with nearby schools including Spring Lake Elementary, Payson Junior High School, and Payson High School.
Ownership History
Date
Name
Owned For
Owner Type
Purchase Details
Closed on
Oct 29, 2020
Sold by
Alburqueque John Vilela
Bought by
Alburqueque John Vilela and Duenas Yolanda
Current Estimated Value
Home Financials for this Owner
Home Financials are based on the most recent Mortgage that was taken out on this home.
Original Mortgage
$241,000
Outstanding Balance
$174,076
Interest Rate
2.8%
Mortgage Type
New Conventional
Estimated Equity
$386,186
Purchase Details
Closed on
Oct 26, 2020
Sold by
Vilela John and Duenas Yolanda
Bought by
Alburqueque John Vilela
Home Financials for this Owner
Home Financials are based on the most recent Mortgage that was taken out on this home.
Original Mortgage
$241,000
Outstanding Balance
$174,076
Interest Rate
2.8%
Mortgage Type
New Conventional
Estimated Equity
$386,186
Purchase Details
Closed on
May 25, 2016
Sold by
Slater Jeremy S and Slater Renee D
Bought by
Vilela John and Duenas Yolanda
Home Financials for this Owner
Home Financials are based on the most recent Mortgage that was taken out on this home.
Original Mortgage
$266,509
Interest Rate
3.58%
Mortgage Type
New Conventional
Purchase Details
Closed on
Dec 1, 2008
Sold by
Slater Jeremy S and Slater Renee
Bought by
Slater Jeremy S and Slater Renee D
Home Financials for this Owner
Home Financials are based on the most recent Mortgage that was taken out on this home.
Original Mortgage
$206,500
Interest Rate
6.04%
Mortgage Type
New Conventional
Purchase Details
Closed on
Jul 16, 2001
Sold by
Building Youth Institute
Bought by
Slater Jeremy S and Slater Renee
Home Financials for this Owner
Home Financials are based on the most recent Mortgage that was taken out on this home.
Original Mortgage
$150,385
Interest Rate
7.26%
Purchase Details
Closed on
Sep 19, 2000
Sold by
Hearthstone Development Inc
Bought by
Payson Farms Lc
Purchase Details
Closed on
Sep 6, 2000
Sold by
Houtz David B
Bought by
Building Youth Institute
Create a Home Valuation Report for This Property
The Home Valuation Report is an in-depth analysis detailing your home's value as well as a comparison with similar homes in the area
Home Values in the Area
Average Home Value in this Area
Purchase History
| Date | Buyer | Sale Price | Title Company |
|---|---|---|---|
| Alburqueque John Vilela | -- | Vanguard Title Ins Agcy Llc | |
| Alburqueque John Vilela | -- | Vanguard Title Ins Agcy Inc | |
| Vilela John | -- | First American Title Ins Age | |
| Slater Jeremy S | -- | Affiliated First Title Corp | |
| Slater Jeremy S | -- | First American Title Insuran | |
| Payson Farms Lc | -- | Pro Title & Escrow Inc | |
| Building Youth Institute | -- | Pro Title & Escrow Inc | |
| Houtz David B | -- | Pro Title & Escrow Inc |
Source: Public Records
Mortgage History
| Date | Status | Borrower | Loan Amount |
|---|---|---|---|
| Open | Alburqueque John Vilela | $241,000 | |
| Previous Owner | Vilela John | $266,509 | |
| Previous Owner | Slater Jeremy S | $206,500 | |
| Previous Owner | Slater Jeremy S | $150,385 |
Source: Public Records
Tax History Compared to Growth
Tax History
| Year | Tax Paid | Tax Assessment Tax Assessment Total Assessment is a certain percentage of the fair market value that is determined by local assessors to be the total taxable value of land and additions on the property. | Land | Improvement |
|---|---|---|---|---|
| 2025 | $2,691 | $293,095 | $176,000 | $356,900 |
| 2024 | $2,691 | $273,845 | $0 | $0 |
| 2023 | $2,720 | $277,530 | $0 | $0 |
| 2022 | $2,671 | $268,125 | $0 | $0 |
| 2021 | $2,262 | $364,200 | $115,500 | $248,700 |
| 2020 | $2,145 | $337,900 | $105,000 | $232,900 |
| 2019 | $1,981 | $319,800 | $86,900 | $232,900 |
| 2018 | $1,793 | $279,000 | $76,100 | $202,900 |
| 2017 | $1,718 | $143,770 | $0 | $0 |
| 2016 | $1,651 | $137,280 | $0 | $0 |
| 2015 | $1,591 | $131,395 | $0 | $0 |
| 2014 | $1,461 | $121,495 | $0 | $0 |
Source: Public Records
Map
Nearby Homes