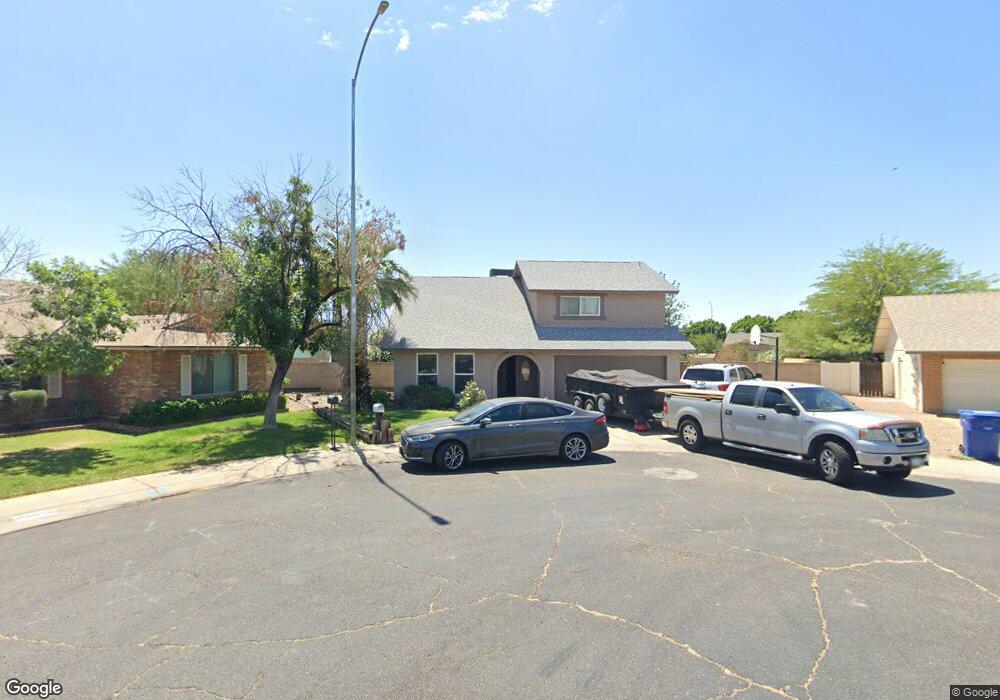
1255 W Kiowa Cir Unit 3 Mesa, AZ 85202
Dobson NeighborhoodEstimated Value: $573,356 - $680,000
--
Bed
3
Baths
2,651
Sq Ft
$240/Sq Ft
Est. Value
About This Home
This home is located at 1255 W Kiowa Cir Unit 3, Mesa, AZ 85202 and is currently estimated at $635,589, approximately $239 per square foot. 1255 W Kiowa Cir Unit 3 is a home located in Maricopa County with nearby schools including Franklin at Brimhall Elementary School, Washington Elementary School, and Franklin Accelerated Academy Jordan Campus.
Ownership History
Date
Name
Owned For
Owner Type
Purchase Details
Closed on
Dec 6, 2012
Sold by
Flynn David and Flynn Stacey L
Bought by
Flynn David E and Flynn Stcey L
Current Estimated Value
Home Financials for this Owner
Home Financials are based on the most recent Mortgage that was taken out on this home.
Original Mortgage
$188,940
Outstanding Balance
$130,781
Interest Rate
3.35%
Mortgage Type
VA
Estimated Equity
$504,808
Purchase Details
Closed on
Apr 9, 2002
Sold by
Richards Reginald L and Richards Linda M
Bought by
Flynn David and Flynn Stacey L
Home Financials for this Owner
Home Financials are based on the most recent Mortgage that was taken out on this home.
Original Mortgage
$222,480
Interest Rate
7.08%
Mortgage Type
VA
Create a Home Valuation Report for This Property
The Home Valuation Report is an in-depth analysis detailing your home's value as well as a comparison with similar homes in the area
Home Values in the Area
Average Home Value in this Area
Purchase History
| Date | Buyer | Sale Price | Title Company |
|---|---|---|---|
| Flynn David E | -- | Lawyers Title Of Arizona Inc | |
| Flynn David | $216,000 | Security Title Agency |
Source: Public Records
Mortgage History
| Date | Status | Borrower | Loan Amount |
|---|---|---|---|
| Open | Flynn David E | $188,940 | |
| Closed | Flynn David | $222,480 |
Source: Public Records
Tax History Compared to Growth
Tax History
| Year | Tax Paid | Tax Assessment Tax Assessment Total Assessment is a certain percentage of the fair market value that is determined by local assessors to be the total taxable value of land and additions on the property. | Land | Improvement |
|---|---|---|---|---|
| 2025 | $2,105 | $25,342 | -- | -- |
| 2024 | $2,127 | $24,135 | -- | -- |
| 2023 | $2,127 | $44,350 | $8,870 | $35,480 |
| 2022 | $2,081 | $32,860 | $6,570 | $26,290 |
| 2021 | $2,138 | $31,060 | $6,210 | $24,850 |
| 2020 | $2,109 | $29,460 | $5,890 | $23,570 |
| 2019 | $1,954 | $27,550 | $5,510 | $22,040 |
| 2018 | $1,866 | $25,650 | $5,130 | $20,520 |
| 2017 | $1,807 | $24,510 | $4,900 | $19,610 |
| 2016 | $1,774 | $25,000 | $5,000 | $20,000 |
| 2015 | $1,675 | $22,310 | $4,460 | $17,850 |
Source: Public Records
Map
Nearby Homes
- 1338 W Lobo Ave
- 1255 W Baseline Rd Unit B139
- 1358 W Lobo Ave
- 1331 W Baseline Rd Unit 167
- 1331 W Baseline Rd Unit 251
- 1331 W Baseline Rd Unit 148
- 1331 W Baseline Rd Unit 171
- 1331 W Baseline Rd Unit 348
- 1331 W Baseline Rd Unit 272
- 1331 W Baseline Rd Unit 253
- 1331 W Baseline Rd Unit 102
- 1331 W Baseline Rd Unit 153
- 2156 S Emerson
- 1160 W Madero Cir
- 2061 S Rogers
- 1231 W Baseline Rd
- 2406 S Mulberry
- 2019 S Henkel Cir
- 2522 S Spruce
- 1005 W Madero Ave
- 1261 W Kiowa Cir
- 1260 W Los Lagos Vista Unit ID1247581P
- 1246 W Kiowa Cir
- 1252 W Los Lagos Vista
- 1260 W Los Lagos Vista
- 2248 S Canton
- 2242 S Canton
- 2254 S Canton
- 2238 S Canton
- 1265 W Kiowa Cir
- 1254 W Kiowa Cir
- 1264 W Los Lagos Vista
- 1262 W Kiowa Cir Unit 3
- 2234 S Canton
- 1251 W Los Lagos Vista
- 2235 S Patterson
- 1259 W Los Lagos Vista
- 1243 W Los Lagos Vista
- 2243 S Canton
- 2237 S Canton