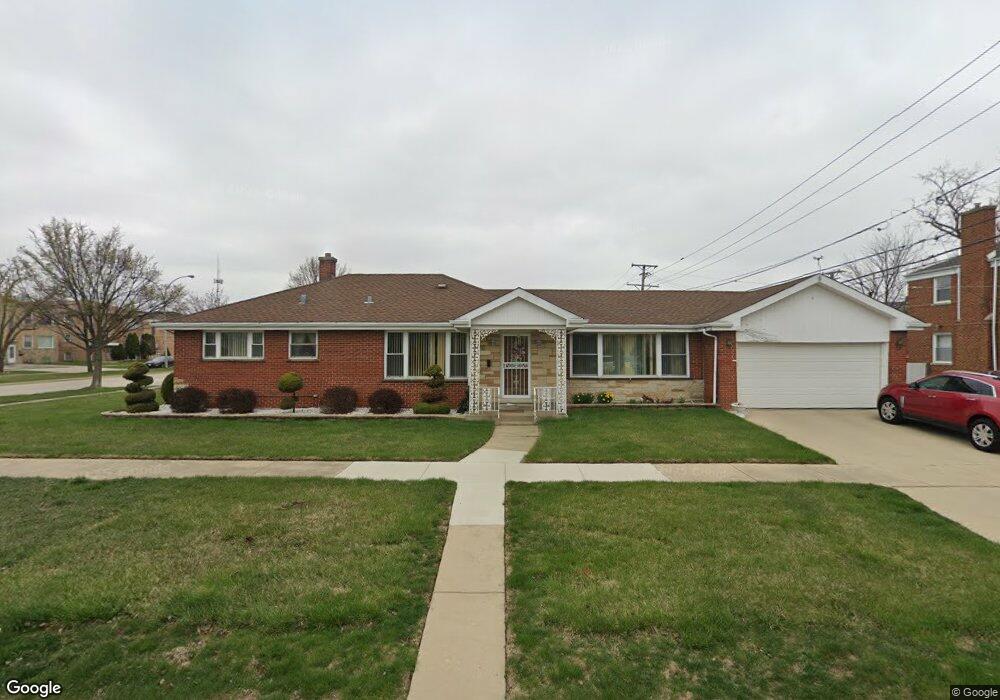
1255 Westchester Blvd Westchester, IL 60154
Estimated Value: $313,681 - $418,000
3
Beds
2
Baths
1,461
Sq Ft
$253/Sq Ft
Est. Value
About This Home
This home is located at 1255 Westchester Blvd, Westchester, IL 60154 and is currently estimated at $369,920, approximately $253 per square foot. 1255 Westchester Blvd is a home located in Cook County with nearby schools including Westchester Primary School, Westchester Intermediate School, and Westchester Middle School.
Ownership History
Date
Name
Owned For
Owner Type
Purchase Details
Closed on
Jan 26, 2012
Sold by
Cleveland Ire C and Jackson Ire C
Bought by
Cleveland Ire C and Cleveland Bernie
Current Estimated Value
Home Financials for this Owner
Home Financials are based on the most recent Mortgage that was taken out on this home.
Original Mortgage
$292,500
Outstanding Balance
$194,738
Interest Rate
3.31%
Mortgage Type
Reverse Mortgage Home Equity Conversion Mortgage
Estimated Equity
$175,182
Purchase Details
Closed on
Nov 16, 1998
Sold by
Antonelli Edward A and Antonelli Patricia A
Bought by
Norris Johnnie and Jackson Ire C
Home Financials for this Owner
Home Financials are based on the most recent Mortgage that was taken out on this home.
Original Mortgage
$120,000
Interest Rate
6.59%
Purchase Details
Closed on
Mar 9, 1990
Sold by
Tsilivis James
Bought by
Antonelli Edward A and Antonelli Patricia A
Create a Home Valuation Report for This Property
The Home Valuation Report is an in-depth analysis detailing your home's value as well as a comparison with similar homes in the area
Home Values in the Area
Average Home Value in this Area
Purchase History
| Date | Buyer | Sale Price | Title Company |
|---|---|---|---|
| Cleveland Ire C | -- | None Available | |
| Norris Johnnie | $170,000 | -- | |
| Antonelli Edward A | $134,500 | -- |
Source: Public Records
Mortgage History
| Date | Status | Borrower | Loan Amount |
|---|---|---|---|
| Open | Cleveland Ire C | $292,500 | |
| Closed | Norris Johnnie | $120,000 |
Source: Public Records
Tax History Compared to Growth
Tax History
| Year | Tax Paid | Tax Assessment Tax Assessment Total Assessment is a certain percentage of the fair market value that is determined by local assessors to be the total taxable value of land and additions on the property. | Land | Improvement |
|---|---|---|---|---|
| 2024 | $1,947 | $20,777 | $2,013 | $18,764 |
| 2023 | $2,335 | $20,777 | $2,013 | $18,764 |
| 2022 | $2,335 | $16,870 | $1,725 | $15,145 |
| 2021 | $2,201 | $16,870 | $1,725 | $15,145 |
| 2020 | $2,003 | $16,870 | $1,725 | $15,145 |
| 2019 | $2,168 | $18,933 | $1,581 | $17,352 |
| 2018 | $2,143 | $18,933 | $1,581 | $17,352 |
| 2017 | $2,065 | $18,933 | $1,581 | $17,352 |
| 2016 | $2,890 | $16,216 | $1,437 | $14,779 |
| 2015 | $2,997 | $16,216 | $1,437 | $14,779 |
| 2014 | $2,866 | $16,216 | $1,437 | $14,779 |
| 2013 | $2,623 | $17,641 | $1,437 | $16,204 |
Source: Public Records
Map
Nearby Homes
- 10072 Drury Ln
- 1119 Newcastle Ave
- 1247 S Mannheim Rd Unit 3
- 920 Suffolk Ave
- 814 Norfolk Ave
- 923 Manchester Ave
- 723 Balmoral Ave
- 805 Norfolk Ave
- 10524 Camelot St
- 1500 Bristol Ave
- 10531 Camelot St
- 750 Bristol Ave
- 1623 Manchester Ave
- 1601 Bristol Ave
- 1136 Park Place
- 626 Manchester Ave
- 10567 Waterford Dr
- 1816 Manchester Ave
- 1102 Marshall Ave
- 1907 Suffolk Ave
- 1255 Westchester Blvd
- 10140 Cambridge St
- 1303 Westchester Blvd
- 1249 Westchester Blvd
- 1249 Westchester Blvd
- 1249 Westchester Blvd
- 10136 Cambridge St
- 1239 Westchester Blvd
- 1300 Hull Ave
- 1307 Westchester Blvd
- 10130 Cambridge St
- 10141 Pelham St
- 1306 Hull Ave
- 1235 Westchester Blvd
- 10137 Pelham St
- 1313 Westchester Blvd
- 1244 Westchester Blvd
- 10126 Cambridge St
- 1310 Hull Ave