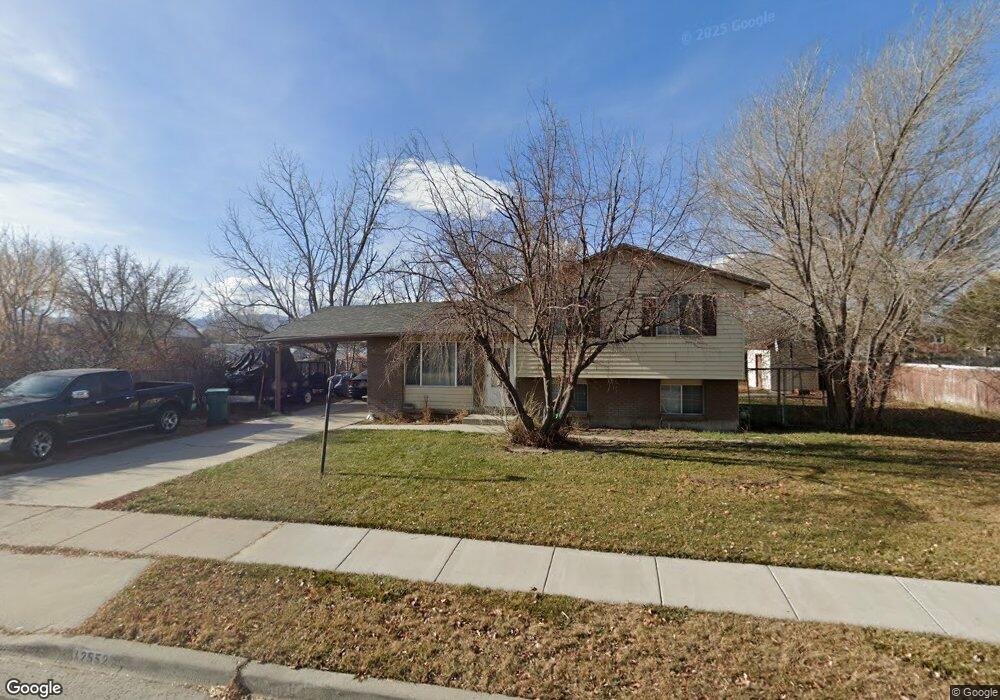
12552 S 1450 W Riverton, UT 84065
Estimated Value: $449,000 - $517,000
4
Beds
2
Baths
1,465
Sq Ft
$334/Sq Ft
Est. Value
About This Home
This home is located at 12552 S 1450 W, Riverton, UT 84065 and is currently estimated at $488,764, approximately $333 per square foot. 12552 S 1450 W is a home located in Salt Lake County with nearby schools including Rosamond Elementary School, Oquirrh Hills Middle School, and Riverton High School.
Ownership History
Date
Name
Owned For
Owner Type
Purchase Details
Closed on
Feb 13, 2013
Sold by
Red Adobe Investments Llc
Bought by
Privett Ashley L
Current Estimated Value
Home Financials for this Owner
Home Financials are based on the most recent Mortgage that was taken out on this home.
Original Mortgage
$153,000
Outstanding Balance
$106,559
Interest Rate
3.33%
Mortgage Type
New Conventional
Estimated Equity
$382,205
Purchase Details
Closed on
Feb 4, 2013
Sold by
Red Adobe Investments Llc
Bought by
Privett Ashley L
Home Financials for this Owner
Home Financials are based on the most recent Mortgage that was taken out on this home.
Original Mortgage
$153,000
Outstanding Balance
$106,559
Interest Rate
3.33%
Mortgage Type
New Conventional
Estimated Equity
$382,205
Purchase Details
Closed on
Dec 23, 2002
Sold by
Obray James D
Bought by
Blubaugh Gerald G
Home Financials for this Owner
Home Financials are based on the most recent Mortgage that was taken out on this home.
Original Mortgage
$132,600
Interest Rate
5.86%
Mortgage Type
VA
Create a Home Valuation Report for This Property
The Home Valuation Report is an in-depth analysis detailing your home's value as well as a comparison with similar homes in the area
Home Values in the Area
Average Home Value in this Area
Purchase History
| Date | Buyer | Sale Price | Title Company |
|---|---|---|---|
| Privett Ashley L | -- | Meridian Title | |
| Privett Ashley L | -- | Meridian Title | |
| Blubaugh Gerald G | -- | Integrated Title Ins Service |
Source: Public Records
Mortgage History
| Date | Status | Borrower | Loan Amount |
|---|---|---|---|
| Open | Privett Ashley L | $153,000 | |
| Previous Owner | Blubaugh Gerald G | $132,600 |
Source: Public Records
Tax History Compared to Growth
Tax History
| Year | Tax Paid | Tax Assessment Tax Assessment Total Assessment is a certain percentage of the fair market value that is determined by local assessors to be the total taxable value of land and additions on the property. | Land | Improvement |
|---|---|---|---|---|
| 2025 | $2,392 | $423,000 | $205,800 | $217,200 |
| 2024 | $2,392 | $414,000 | $202,100 | $211,900 |
| 2023 | $2,312 | $377,200 | $187,100 | $190,100 |
| 2022 | $2,418 | $387,000 | $183,400 | $203,600 |
| 2021 | $2,082 | $296,700 | $137,600 | $159,100 |
| 2020 | $1,913 | $254,200 | $123,300 | $130,900 |
| 2019 | $1,910 | $249,500 | $112,100 | $137,400 |
| 2018 | $1,798 | $231,200 | $112,100 | $119,100 |
| 2017 | $1,703 | $213,500 | $112,100 | $101,400 |
| 2016 | $1,646 | $198,000 | $97,900 | $100,100 |
| 2015 | $1,601 | $186,700 | $99,600 | $87,100 |
| 2014 | $1,541 | $176,200 | $94,900 | $81,300 |
Source: Public Records
Map
Nearby Homes
- 1373 W Stewart Falls Dr
- 1371 W Stewart Falls Dr
- 1056 W Kate Springs Ln S Unit 10
- 1560 W 12730 S
- 12392 S 1300 W
- 1233 W 12500 S
- 12294 S 1490 W
- 1273 W Hendrix St Unit 145
- 1269 W Hendrix St Unit 146
- 12345 S Redwood Rd
- 1259 W Moon Way Unit 134
- 12325 S Redwood Rd
- 12317 S Redwood Rd
- 12566 S Tithing Hill Dr
- 12216 S 1300 W
- 12952 S Croix Cir
- 1410 W 12115 S
- 13053 S 1300 W
- 1184 W Margaret Rose Dr
- 12091 S Lampton View Dr
- 12555 Harvest Ave
- 1465 W 12525 S
- 1479 W 12525 S
- 12549 Harvest Ave
- 12563 Harvest Ave
- 12537 S 1450 W
- 12537 Harvest Ave
- 12537 S Harvest Ave
- 12575 Harvest Ave
- 12575 S Harvest Ave
- 1460 W 12600 S
- 1481 W 12525 S
- 1472 W 12600 S
- 12523 S 1450 W
- 12587 S Harvest Ave
- 12587 S 1450 W
- 12523 Harvest Ave
- 1464 W 12525 S
- 12587 S Harvest Ave
- 1470 W 12600 S