Estimated Value: $235,509 - $253,000
2
Beds
2
Baths
1,350
Sq Ft
$182/Sq Ft
Est. Value
About This Home
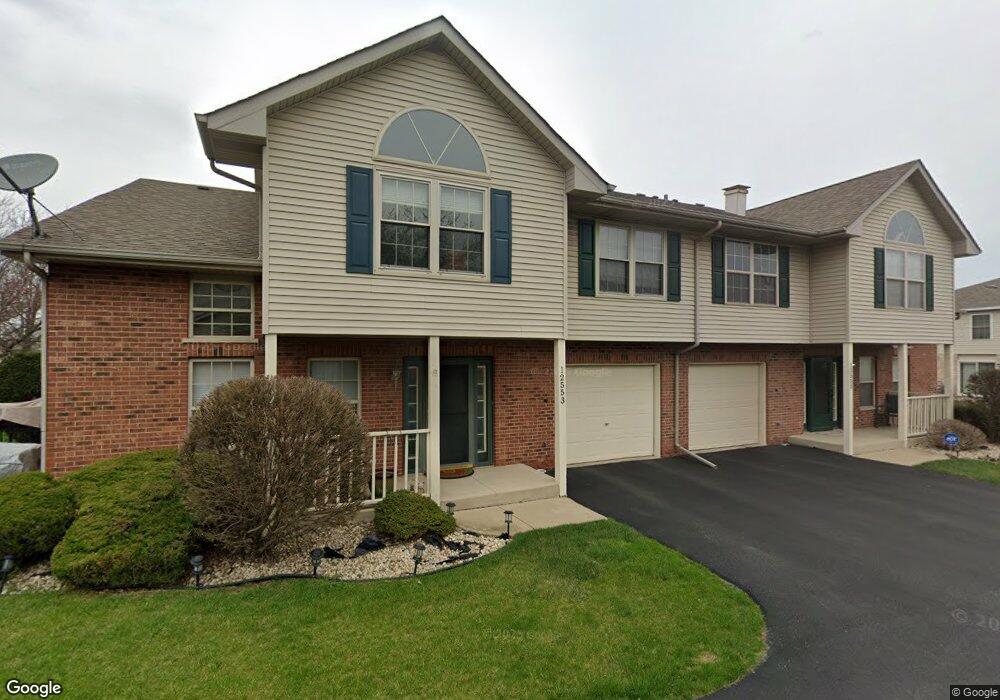
This home is located at 12553 S Quinn Dr Unit 504, Alsip, IL 60803 and is currently estimated at $245,877, approximately $182 per square foot. 12553 S Quinn Dr Unit 504 is a home located in Cook County with nearby schools including George Washington Elementary School, Nathan Hale Middle School, and Dwight D. Eisenhower High School.
Ownership History
Date
Name
Owned For
Owner Type
Purchase Details
Closed on
Aug 28, 2025
Sold by
Mcferren Apryll D
Bought by
Chicago Title Land Trust and Trust Number 8002384009
Current Estimated Value
Purchase Details
Closed on
Oct 16, 2023
Sold by
Chicago Title Land Trust Co
Bought by
Mcferren Apryll D
Home Financials for this Owner
Home Financials are based on the most recent Mortgage that was taken out on this home.
Original Mortgage
$183,964
Interest Rate
6.88%
Mortgage Type
FHA
Purchase Details
Closed on
Aug 11, 2020
Sold by
Mcferren Aryll D
Bought by
Chicago Title Land Trust Company and Trust Number 8002384009
Purchase Details
Closed on
Jan 13, 1997
Sold by
Standard Bank & Trust Company
Bought by
Mcferren Apryll D
Home Financials for this Owner
Home Financials are based on the most recent Mortgage that was taken out on this home.
Original Mortgage
$104,600
Interest Rate
7.92%
Mortgage Type
FHA
Create a Home Valuation Report for This Property
The Home Valuation Report is an in-depth analysis detailing your home's value as well as a comparison with similar homes in the area
Home Values in the Area
Average Home Value in this Area
Purchase History
| Date | Buyer | Sale Price | Title Company |
|---|---|---|---|
| Chicago Title Land Trust | -- | Chicago Title | |
| Mcferren Apryll D | -- | Chicago Title | |
| Chicago Title Land Trust Company | -- | Chicago Title | |
| Mcferren Apryll D | $111,000 | -- |
Source: Public Records
Mortgage History
| Date | Status | Borrower | Loan Amount |
|---|---|---|---|
| Previous Owner | Mcferren Apryll D | $183,964 | |
| Previous Owner | Mcferren Apryll D | $104,600 |
Source: Public Records
Tax History Compared to Growth
Tax History
| Year | Tax Paid | Tax Assessment Tax Assessment Total Assessment is a certain percentage of the fair market value that is determined by local assessors to be the total taxable value of land and additions on the property. | Land | Improvement |
|---|---|---|---|---|
| 2024 | $5,381 | $18,290 | $2,130 | $16,160 |
| 2023 | $3,968 | $18,290 | $2,130 | $16,160 |
| 2022 | $3,968 | $12,542 | $2,323 | $10,219 |
| 2021 | $3,813 | $12,541 | $2,323 | $10,218 |
| 2020 | $3,816 | $12,541 | $2,323 | $10,218 |
| 2019 | $3,910 | $12,813 | $2,129 | $10,684 |
| 2018 | $4,399 | $14,397 | $2,129 | $12,268 |
| 2017 | $4,509 | $14,397 | $2,129 | $12,268 |
| 2016 | $4,507 | $13,320 | $1,742 | $11,578 |
| 2015 | $4,367 | $13,320 | $1,742 | $11,578 |
| 2014 | $4,263 | $13,320 | $1,742 | $11,578 |
| 2013 | $3,841 | $13,203 | $1,742 | $11,461 |
Source: Public Records
Map
Nearby Homes
- 12539 S Quinn Dr Unit 402
- 3729 W Glen Dr Unit 804
- 12521 S Central Park Ave Unit 1
- 3823 W 123rd St Unit 302
- 3821 W 123rd St Unit 301
- 12416 S Trumbull Ave
- 3909 W 123rd St Unit 205A
- 3416 W 124th St
- 12211 S Harding Ave
- 3609 W 121st St
- 12507 S Tripp Ave
- 3754 W 120th St Unit 2D
- 4326 W Emerald Way St
- 4336 W Emerald Way St
- 4343 W Emerald Way St
- 4406 W 127th Place
- 11809 S Millard Ave
- 11750 S Homan Ave Unit J
- 12736 S Kenneth Ave Unit 1A
- 12738 S Kenneth Ave Unit E
- 12549 S Quinn Dr Unit 501
- 12555 S Quinn Dr Unit 503
- 12551 S Quinn Dr Unit 502
- 12561 S Quinn Dr Unit 601
- 12563 S Quinn Dr Unit 602
- 3713 W Glen Dr Unit 701
- 12541 S Quinn Dr Unit 404
- 12543 S Quinn Dr Unit 403
- 3717 W Glen Dr Unit 704
- 3715 W Glen Dr Unit 702
- 12565 S Quinn Dr Unit 604
- 12565 S Quinn Dr Unit 1256
- 12567 S Quinn Dr Unit 603
- 12537 S Quinn Dr Unit 401
- 3719 W Glen Dr Unit 703
- 12524 S Deer Park Dr Unit 12524
- 12520 S Deer Park Dr Unit 12520
- 12514 S Deer Park Dr Unit 12514
- 12518 S Deer Park Dr Unit 12518
- 12530 S Deer Park Dr Unit 12530