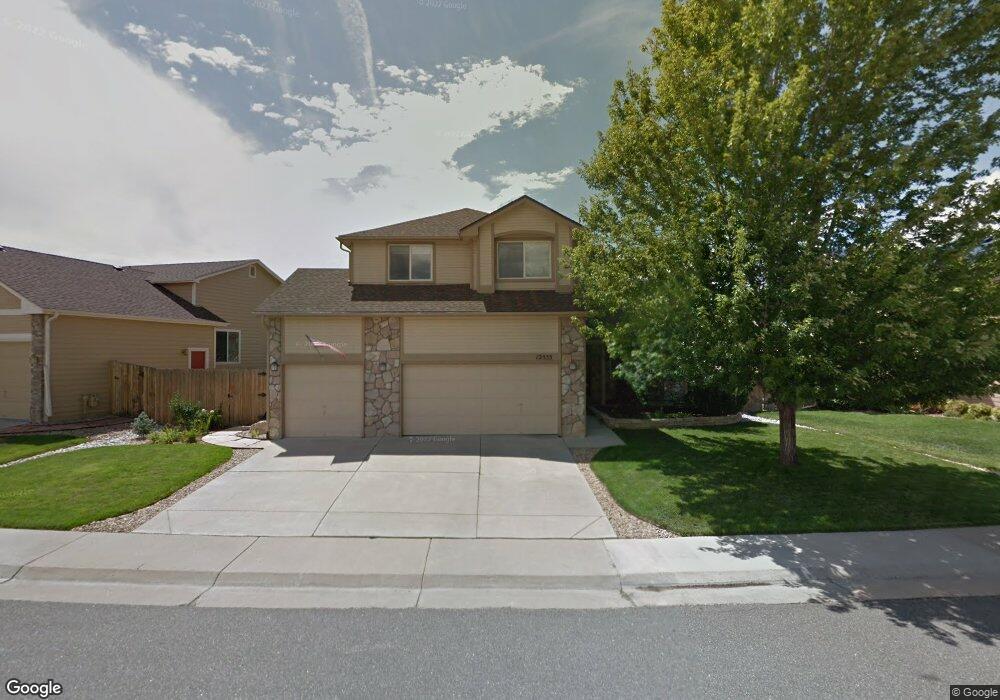
12555 Vrain St Broomfield, CO 80020
Willow Park NeighborhoodEstimated Value: $780,159 - $888,000
4
Beds
3
Baths
3,809
Sq Ft
$214/Sq Ft
Est. Value
About This Home
This home is located at 12555 Vrain St, Broomfield, CO 80020 and is currently estimated at $814,790, approximately $213 per square foot. 12555 Vrain St is a home located in Broomfield County with nearby schools including Mountain View Elementary School, Westlake Middle School, and Legacy High School.
Ownership History
Date
Name
Owned For
Owner Type
Purchase Details
Closed on
May 15, 2019
Sold by
Marko John and Marko Sheila M
Bought by
Mukulak Lauren E and Mukulak Erik P
Current Estimated Value
Home Financials for this Owner
Home Financials are based on the most recent Mortgage that was taken out on this home.
Original Mortgage
$430,000
Outstanding Balance
$376,513
Interest Rate
4%
Mortgage Type
New Conventional
Estimated Equity
$438,277
Purchase Details
Closed on
May 18, 1998
Sold by
Gilligan Family Limited Partne
Bought by
Gallery At Cherrywood Inc
Purchase Details
Closed on
May 8, 1998
Sold by
Gallery At Cherrywood Inc
Bought by
Marko John and Marko Sheila M
Purchase Details
Closed on
Sep 25, 1997
Sold by
Gallery At Countryside
Bought by
Gallery At Cherrywood Inc
Purchase Details
Closed on
Feb 20, 1997
Sold by
Tahc Number Fourteen Inc
Bought by
Gilligan Family Limited Partne
Purchase Details
Closed on
May 11, 1995
Purchase Details
Closed on
May 14, 1993
Purchase Details
Closed on
Mar 4, 1993
Create a Home Valuation Report for This Property
The Home Valuation Report is an in-depth analysis detailing your home's value as well as a comparison with similar homes in the area
Home Values in the Area
Average Home Value in this Area
Purchase History
| Date | Buyer | Sale Price | Title Company |
|---|---|---|---|
| Mukulak Lauren E | $590,000 | Tiago Title Llc | |
| Gallery At Cherrywood Inc | -- | -- | |
| Marko John | $246,200 | -- | |
| Gallery At Cherrywood Inc | -- | -- | |
| Gilligan Family Limited Partne | $287,800 | -- | |
| -- | $975,000 | -- | |
| -- | -- | -- | |
| -- | -- | -- |
Source: Public Records
Mortgage History
| Date | Status | Borrower | Loan Amount |
|---|---|---|---|
| Open | Mukulak Lauren E | $430,000 |
Source: Public Records
Tax History Compared to Growth
Tax History
| Year | Tax Paid | Tax Assessment Tax Assessment Total Assessment is a certain percentage of the fair market value that is determined by local assessors to be the total taxable value of land and additions on the property. | Land | Improvement |
|---|---|---|---|---|
| 2025 | $5,539 | $50,930 | $11,150 | $39,780 |
| 2024 | $5,539 | $51,650 | $10,410 | $41,240 |
| 2023 | $5,488 | $57,390 | $11,560 | $45,830 |
| 2022 | $4,564 | $40,400 | $8,310 | $32,090 |
| 2021 | $4,706 | $41,560 | $8,550 | $33,010 |
| 2020 | $4,487 | $39,200 | $7,810 | $31,390 |
| 2019 | $3,671 | $39,470 | $7,860 | $31,610 |
| 2018 | $3,339 | $35,510 | $6,120 | $29,390 |
| 2017 | $3,042 | $39,270 | $6,770 | $32,500 |
| 2016 | $2,609 | $31,620 | $6,230 | $25,390 |
| 2015 | $3,486 | $27,310 | $6,230 | $21,080 |
| 2014 | $3,094 | $27,310 | $6,230 | $21,080 |
Source: Public Records
Map
Nearby Homes
- 12545 Tammywood St
- 12620 Winona Ct
- 12695 Wolff St
- 12450 Forest View St
- 5005 W 128th Place
- 3974 Cambridge Ave
- 3981 W 127th Ave
- 12205 Pery St
- 12510 Newton St
- 12217 Crabapple St
- 12205 Perry St Unit 17
- 12205 Perry St Unit 259
- 12205 Perry St Unit 167
- 12205 Perry St Unit 67
- 12205 Perry St Unit 287
- 5143 Yates Place
- 1320 Stonehaven Ave
- 12805 King St
- 961 Birch St
- 12528 James Point
- 12545 Vrain St
- 12565 Vrain St
- 12535 Vrain St
- 12575 Vrain St
- 12570 Vrain St
- 12560 Vrain St
- 12580 Vrain St
- 12585 Vrain St
- 12525 Vrain St
- 12540 Vrain St
- 12680 Winona Cir
- 12530 Vrain St
- 12686 Winona Cir
- 12559 Utica St
- 12553 Utica St
- 12563 Utica St
- 12676 Winona Cir
- 12588 Utica St
- 12690 Winona Cir
- 12515 Vrain St