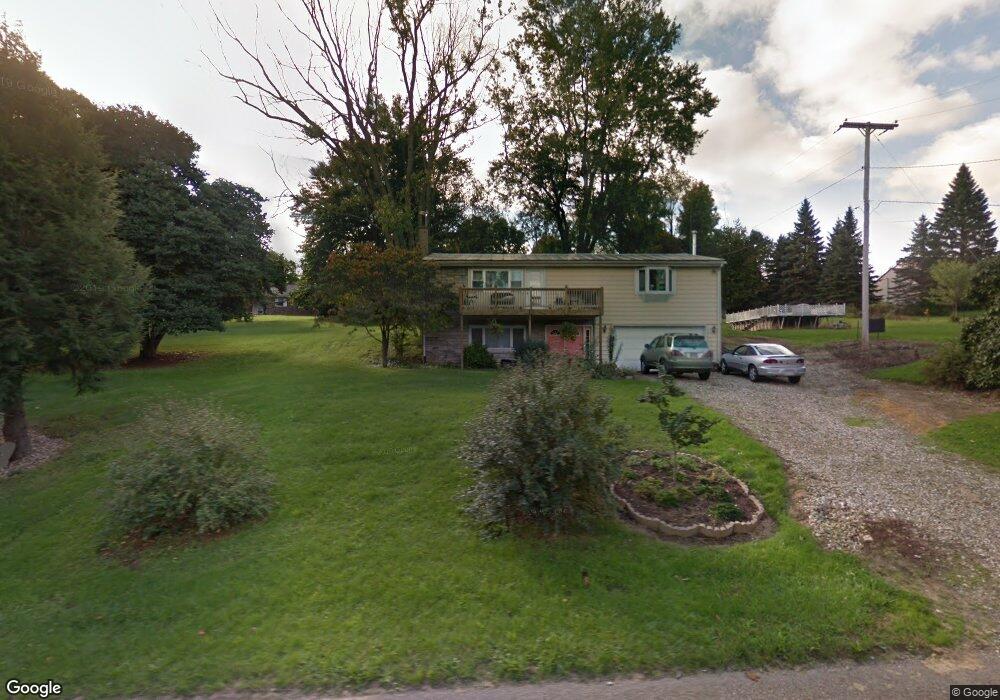
1256 Chew Rd Mansfield, OH 44903
Estimated Value: $232,000 - $287,000
3
Beds
2
Baths
2,146
Sq Ft
$123/Sq Ft
Est. Value
About This Home
This home is located at 1256 Chew Rd, Mansfield, OH 44903 and is currently estimated at $264,654, approximately $123 per square foot. 1256 Chew Rd is a home located in Richland County with nearby schools including Lucas Elementary School, Lucas Heritage Middle School, and Lucas High School.
Ownership History
Date
Name
Owned For
Owner Type
Purchase Details
Closed on
Sep 29, 2023
Sold by
Kent Kyle L and Kent Jessica G
Bought by
Mayer Alexander J and Hornikel Tiffani L
Current Estimated Value
Home Financials for this Owner
Home Financials are based on the most recent Mortgage that was taken out on this home.
Original Mortgage
$100,000
Outstanding Balance
$98,325
Interest Rate
7.18%
Mortgage Type
New Conventional
Estimated Equity
$166,329
Purchase Details
Closed on
Jun 30, 2003
Sold by
Guill Stacie E and Guill Jeffrey D
Bought by
Kent Kyle L and Kent Jessica G
Home Financials for this Owner
Home Financials are based on the most recent Mortgage that was taken out on this home.
Original Mortgage
$121,900
Interest Rate
7.75%
Mortgage Type
Purchase Money Mortgage
Purchase Details
Closed on
Jun 21, 1993
Sold by
Yahney Michael C
Bought by
Constance James A
Purchase Details
Closed on
Nov 13, 1991
Sold by
Palmer James R
Bought by
Yahney Michael C
Create a Home Valuation Report for This Property
The Home Valuation Report is an in-depth analysis detailing your home's value as well as a comparison with similar homes in the area
Home Values in the Area
Average Home Value in this Area
Purchase History
| Date | Buyer | Sale Price | Title Company |
|---|---|---|---|
| Mayer Alexander J | $145,000 | Acs Title | |
| Kent Kyle L | $121,900 | Southern Title | |
| Constance James A | $68,000 | -- | |
| Yahney Michael C | $53,000 | -- |
Source: Public Records
Mortgage History
| Date | Status | Borrower | Loan Amount |
|---|---|---|---|
| Open | Mayer Alexander J | $100,000 | |
| Previous Owner | Kent Kyle L | $124,000 | |
| Previous Owner | Kent Kyle L | $15,600 | |
| Previous Owner | Kent Kyle L | $140,400 | |
| Previous Owner | Kent Kyle L | $132,050 | |
| Previous Owner | Kent Kyle L | $121,900 |
Source: Public Records
Tax History Compared to Growth
Tax History
| Year | Tax Paid | Tax Assessment Tax Assessment Total Assessment is a certain percentage of the fair market value that is determined by local assessors to be the total taxable value of land and additions on the property. | Land | Improvement |
|---|---|---|---|---|
| 2024 | $3,148 | $72,000 | $13,490 | $58,510 |
| 2023 | $3,148 | $64,830 | $6,320 | $58,510 |
| 2022 | $2,360 | $47,320 | $5,430 | $41,890 |
| 2021 | $2,398 | $47,320 | $5,430 | $41,890 |
| 2020 | $2,278 | $47,320 | $5,430 | $41,890 |
| 2019 | $2,041 | $39,660 | $4,550 | $35,110 |
| 2018 | $2,099 | $39,660 | $4,550 | $35,110 |
| 2017 | $1,985 | $39,660 | $4,550 | $35,110 |
| 2016 | $1,858 | $34,940 | $3,870 | $31,070 |
| 2015 | $1,858 | $34,940 | $3,870 | $31,070 |
| 2014 | $1,797 | $34,940 | $3,870 | $31,070 |
| 2012 | $905 | $36,020 | $3,990 | $32,030 |
Source: Public Records
Map
Nearby Homes
- 1875 Mansfield Lucas Rd
- 929 Antionette Dr
- 0 State Route 39 & I-71 Southeast Quadrant
- 0 State Route 39 & I-71 Northeast Quadrant
- 1679 Pulver Rd
- 0 Woodville Rd Unit Lot 14952, 14953
- 0 Woodville Rd Unit Lot 14954, 14955
- 0 Woodville Rd Unit Lot 14956, 14957,
- 794 Mansfield Washington Rd
- 2061 Washington North Rd
- 716 Mansfield Washington Rd
- 405 Plainview Ave
- 1135 E Hanley Rd
- 369 Davidson St
- 419 Pearl Ave
- 36 Ridge Rd S
- 413 Ruby Ave
- 138 Cliffbrook Dr
- 62 Bahl Ave
- 953 Park Ave E