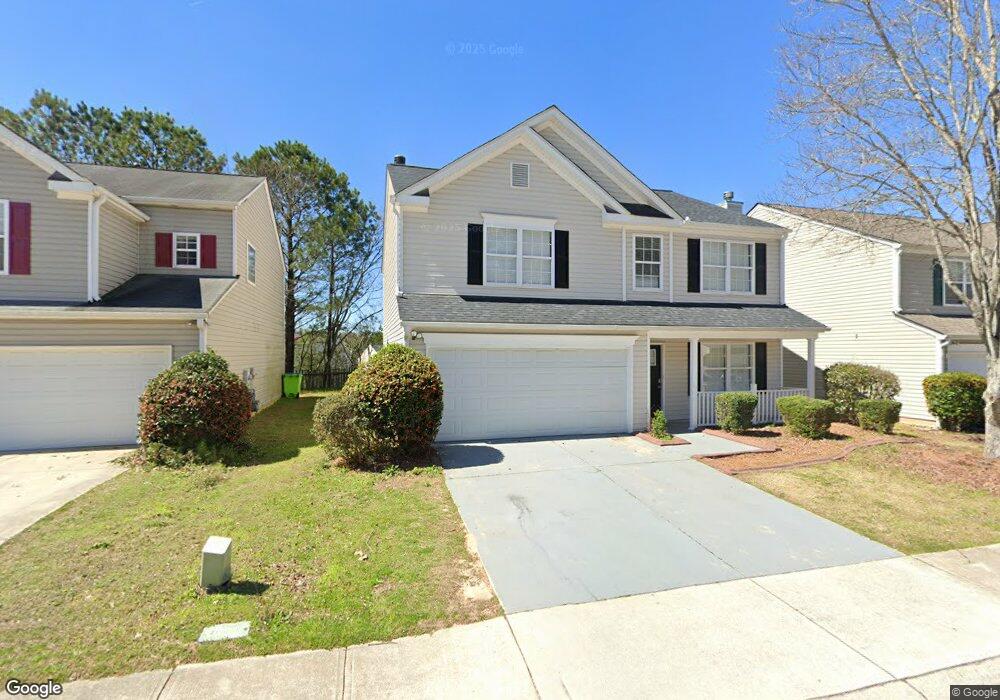
1256 Matt Moore Ct Lithia Springs, GA 30122
Lithia Springs NeighborhoodEstimated Value: $305,559 - $376,000
3
Beds
3
Baths
2,249
Sq Ft
$149/Sq Ft
Est. Value
About This Home
This home is located at 1256 Matt Moore Ct, Lithia Springs, GA 30122 and is currently estimated at $336,140, approximately $149 per square foot. 1256 Matt Moore Ct is a home located in Douglas County with nearby schools including Lithia Springs Elementary School, Turner Middle School, and Lithia Springs Comprehensive High School.
Ownership History
Date
Name
Owned For
Owner Type
Purchase Details
Closed on
Jan 24, 2025
Sold by
Sfr Xii Nm Atl Owner 1 Lp
Bought by
Star Borrower Sfr5 Lp
Current Estimated Value
Purchase Details
Closed on
Jun 23, 2022
Sold by
Sfr Xii Atl Owner 5 Lp
Bought by
Sfr Xii Nm Atl Owner 1 Lp
Purchase Details
Closed on
Dec 1, 2021
Sold by
Cedarcrest Investments Llc
Bought by
Sfr Xii Atl Owner 5 Lp
Purchase Details
Closed on
Nov 4, 2021
Sold by
Harden Elliott
Bought by
Cedarcrest Investments Llc
Purchase Details
Closed on
Apr 28, 2003
Sold by
Colony Homes Llc
Bought by
Harden Elliott
Home Financials for this Owner
Home Financials are based on the most recent Mortgage that was taken out on this home.
Original Mortgage
$147,378
Interest Rate
5.86%
Mortgage Type
FHA
Create a Home Valuation Report for This Property
The Home Valuation Report is an in-depth analysis detailing your home's value as well as a comparison with similar homes in the area
Home Values in the Area
Average Home Value in this Area
Purchase History
| Date | Buyer | Sale Price | Title Company |
|---|---|---|---|
| Star Borrower Sfr5 Lp | $7,945,000 | None Listed On Document | |
| Star Borrower Sfr5 Lp | $7,945,000 | None Listed On Document | |
| Sfr Xii Nm Atl Owner 1 Lp | -- | None Listed On Document | |
| Sfr Xii Nm Atl Owner 1 Lp | -- | None Listed On Document | |
| Sfr Xii Atl Owner 5 Lp | $260,000 | Weissman Pc | |
| Sfr Xii Atl Owner 5 Lp | $260,000 | -- | |
| Cedarcrest Investments Llc | $200,000 | -- | |
| Harden Elliott | $148,800 | -- |
Source: Public Records
Mortgage History
| Date | Status | Borrower | Loan Amount |
|---|---|---|---|
| Previous Owner | Harden Elliott | $147,378 |
Source: Public Records
Tax History Compared to Growth
Tax History
| Year | Tax Paid | Tax Assessment Tax Assessment Total Assessment is a certain percentage of the fair market value that is determined by local assessors to be the total taxable value of land and additions on the property. | Land | Improvement |
|---|---|---|---|---|
| 2024 | $4,572 | $143,240 | $24,960 | $118,280 |
| 2023 | $4,572 | $143,240 | $24,960 | $118,280 |
| 2022 | $3,411 | $102,760 | $21,280 | $81,480 |
| 2021 | $2,347 | $69,960 | $12,120 | $57,840 |
| 2020 | $2,376 | $69,960 | $12,120 | $57,840 |
| 2019 | $2,173 | $68,360 | $12,120 | $56,240 |
| 2018 | $1,858 | $57,920 | $10,640 | $47,280 |
| 2017 | $1,715 | $52,320 | $10,640 | $41,680 |
| 2016 | $1,658 | $49,640 | $10,520 | $39,120 |
| 2015 | $1,461 | $42,640 | $9,280 | $33,360 |
| 2014 | $1,229 | $34,920 | $8,160 | $26,760 |
| 2013 | -- | $34,160 | $8,040 | $26,120 |
Source: Public Records
Map
Nearby Homes
- 0 Vulcan Dr Unit 10471332
- 0 Vulcan Dr Unit 7530603
- 2741 Groovers Lake Point
- 2683 Jordan Ln
- 2694 Jordan Ln
- 2694 Jordan Ln Unit 23
- 2623 Jordan Ln
- 2693 Jordan Ln
- Bradley Plan at The View at Groover's Lake - Georgian Series
- Wisteria Plan at The View at Groover's Lake - Georgian Series
- Bayberry Plan at The View at Groover's Lake - Georgian Series
- Redbud Plan at The View at Groover's Lake - Georgian Series
- 7315 Lee Rd
- 0 W Lake Vulcan Dr Unit 10587241
- 7104 Miller St
- 3403 Linda Dr
- 7814 Messina Ct
- 8816 Sibella Ct
- 3245 W Anderson Dr
- 3017 Bellingham Way
- 1256 Matt Moore Ct
- 1254 Matt Moore Ct
- 1258 Matt Moore Ct
- 1206 Andrews Dr
- 1208 Andrews Dr
- 1208 Andrews Dr
- 1252 Matt Moore Ct Unit 1
- 1260 Matt Moore Ct
- 1210 Andrews Dr
- 1204 Andrews Dr Unit 1
- 1257 Matt Moore Ct
- 1259 Matt Moore Ct
- 1255 Matt Moore Ct
- 1264 Matt Moore Ct
- 1261 Matt Moore Ct
- 1253 Matt Moore Ct Unit 1
- 1212 Andrews Dr Unit 1
- 0 Andrews Dr Unit 8446760
- 0 Andrews Dr Unit 8240320
- 0 Andrews Dr Unit 8122761