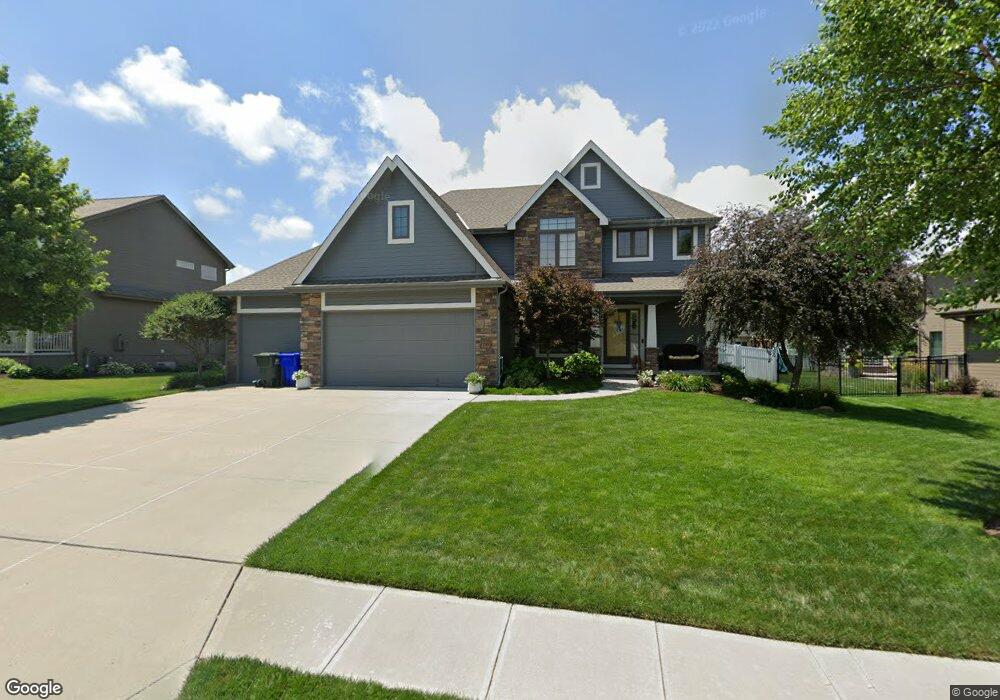
12560 S 80th St Papillion, NE 68046
Estimated Value: $557,000 - $753,000
4
Beds
4
Baths
2,725
Sq Ft
$238/Sq Ft
Est. Value
About This Home
This home is located at 12560 S 80th St, Papillion, NE 68046 and is currently estimated at $648,265, approximately $237 per square foot. 12560 S 80th St is a home located in Sarpy County with nearby schools including Bell Elementary School, Papillion Middle School, and Papillion La Vista South High School.
Ownership History
Date
Name
Owned For
Owner Type
Purchase Details
Closed on
Jul 1, 2011
Sold by
Tyrance Marcus J and Tyrance Stephani N
Bought by
Allrich Craig A and Allrich Alice E
Current Estimated Value
Home Financials for this Owner
Home Financials are based on the most recent Mortgage that was taken out on this home.
Original Mortgage
$305,000
Interest Rate
4.53%
Purchase Details
Closed on
Apr 5, 2011
Sold by
Castlebridge Homes Inc
Bought by
Tyrance Marcus J and Tyrance Stephani N
Home Financials for this Owner
Home Financials are based on the most recent Mortgage that was taken out on this home.
Original Mortgage
$278,212
Interest Rate
4.82%
Purchase Details
Closed on
Sep 3, 2010
Sold by
Shadow Lake Development Llc
Bought by
Castlebridge Homes Inc
Home Financials for this Owner
Home Financials are based on the most recent Mortgage that was taken out on this home.
Original Mortgage
$243,000
Interest Rate
4.55%
Mortgage Type
Small Business Administration
Create a Home Valuation Report for This Property
The Home Valuation Report is an in-depth analysis detailing your home's value as well as a comparison with similar homes in the area
Home Values in the Area
Average Home Value in this Area
Purchase History
| Date | Buyer | Sale Price | Title Company |
|---|---|---|---|
| Allrich Craig A | $305,000 | Omaha Title & Escrow Inc | |
| Tyrance Marcus J | $310,000 | Omaha Title & Escrow Inc | |
| Castlebridge Homes Inc | $42,000 | None Available |
Source: Public Records
Mortgage History
| Date | Status | Borrower | Loan Amount |
|---|---|---|---|
| Previous Owner | Allrich Craig A | $305,000 | |
| Previous Owner | Tyrance Marcus J | $278,212 | |
| Previous Owner | Castlebridge Homes Inc | $243,000 |
Source: Public Records
Tax History Compared to Growth
Tax History
| Year | Tax Paid | Tax Assessment Tax Assessment Total Assessment is a certain percentage of the fair market value that is determined by local assessors to be the total taxable value of land and additions on the property. | Land | Improvement |
|---|---|---|---|---|
| 2025 | -- | $466,980 | $70,000 | $396,980 |
| 2024 | -- | $454,064 | $65,000 | $389,064 |
| 2023 | -- | $415,430 | $59,500 | $355,930 |
| 2022 | $0 | $382,658 | $59,500 | $323,158 |
| 2021 | $0 | $363,339 | $52,000 | $311,339 |
| 2020 | $0 | $356,548 | $52,000 | $304,548 |
| 2019 | $0 | $356,063 | $50,000 | $306,063 |
| 2018 | $0 | $350,316 | $50,000 | $300,316 |
| 2017 | $0 | $346,130 | $50,000 | $296,130 |
| 2016 | -- | $317,969 | $50,000 | $267,969 |
| 2015 | $8,021 | $308,093 | $50,000 | $258,093 |
| 2014 | $8,021 | $305,799 | $46,000 | $259,799 |
| 2012 | -- | $301,536 | $44,000 | $257,536 |
Source: Public Records
Map
Nearby Homes
- 12613 S 79 St
- 12616 S 78th Ave
- 12620 S 78th Ave
- 12715 S 79th St
- 8702 Reed St Unit Lot 60
- 8616 Reed St Unit Lot 61
- 8804 Reed St Unit Lot 58
- 8808 Reed St Unit Lot 57
- 8902 Reed St Unit Lot 56
- 8906 Reed St Unit Lot 55
- 12717 S 77th St
- 2415 Corn Dr
- 2405 Laura Cir
- 12605 S 75th St
- 12359 S 86th St
- Lot 65 Shadow Creek
- 2209 Corn Dr
- 8610 Legacy St
- 8705 Legacy St
- 8709 Legacy St Unit Lot 69
- 12606 S 80th St
- 12552 S 80th St
- 12559 S 81st St
- 12614 S 80th St
- 12567 S 80th St
- 12567 S 81st St
- 12551 S 81st St
- 12559 S 80th St
- 12607 S 80th St
- 12729 S 81st St
- S S 81st St
- 12605 S 81st St
- 12551 S 80th St
- 12615 S 80th St
- 12523 S 81st St
- 12622 S 80th St
- 12550 S 81st St
- 12586 S 79th Ave
- 12558 S 81st St
- 12613 S 81st St