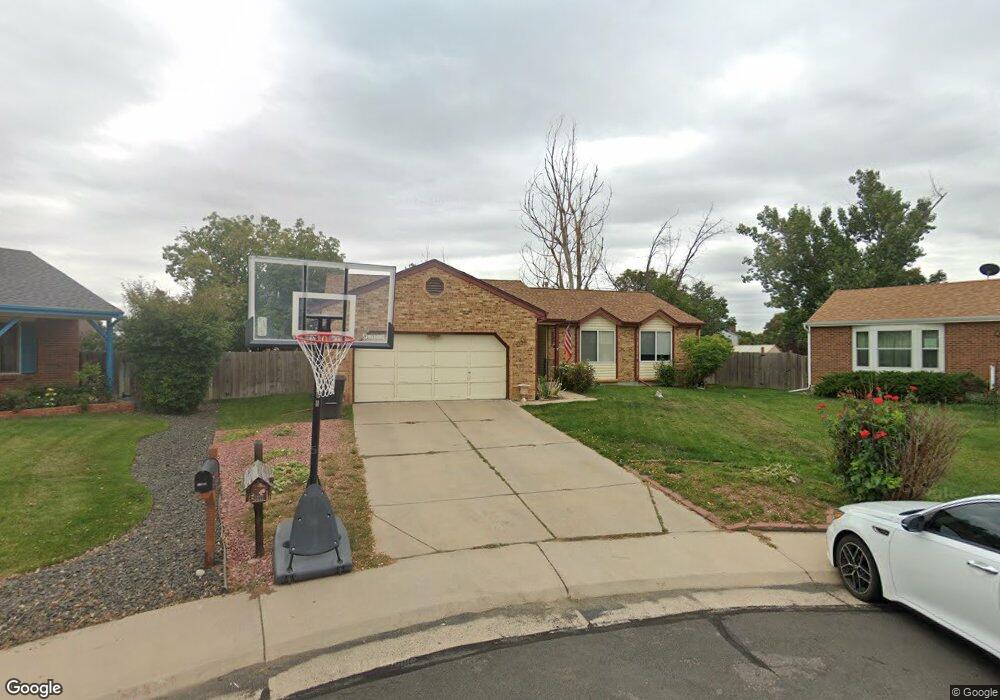
12566 Ash St Thornton, CO 80241
Northaven NeighborhoodEstimated Value: $458,000 - $514,000
3
Beds
2
Baths
1,474
Sq Ft
$324/Sq Ft
Est. Value
About This Home
This home is located at 12566 Ash St, Thornton, CO 80241 and is currently estimated at $478,199, approximately $324 per square foot. 12566 Ash St is a home located in Adams County with nearby schools including Skyview Elementary School, Shadow Ridge Middle School, and Horizon High School.
Ownership History
Date
Name
Owned For
Owner Type
Purchase Details
Closed on
Sep 4, 2001
Sold by
Kyle Michael J and Taylor Linda S
Bought by
Kyle Michael J and Kyle Linda S
Current Estimated Value
Purchase Details
Closed on
Aug 26, 1999
Sold by
Gibson Arnold C
Bought by
Kyle Michael J and Taylor Linda S
Home Financials for this Owner
Home Financials are based on the most recent Mortgage that was taken out on this home.
Original Mortgage
$146,200
Outstanding Balance
$46,311
Interest Rate
9.75%
Estimated Equity
$431,888
Create a Home Valuation Report for This Property
The Home Valuation Report is an in-depth analysis detailing your home's value as well as a comparison with similar homes in the area
Home Values in the Area
Average Home Value in this Area
Purchase History
| Date | Buyer | Sale Price | Title Company |
|---|---|---|---|
| Kyle Michael J | -- | -- | |
| Kyle Michael J | $172,000 | Stewart Title |
Source: Public Records
Mortgage History
| Date | Status | Borrower | Loan Amount |
|---|---|---|---|
| Open | Kyle Michael J | $146,200 | |
| Closed | Kyle Michael J | $25,800 |
Source: Public Records
Tax History
| Year | Tax Paid | Tax Assessment Tax Assessment Total Assessment is a certain percentage of the fair market value that is determined by local assessors to be the total taxable value of land and additions on the property. | Land | Improvement |
|---|---|---|---|---|
| 2025 | $3,102 | $31,210 | $6,530 | $24,680 |
| 2024 | $3,102 | $28,690 | $6,000 | $22,690 |
| 2023 | $3,071 | $33,690 | $6,090 | $27,600 |
| 2022 | $2,881 | $26,150 | $6,050 | $20,100 |
| 2021 | $2,976 | $26,150 | $6,050 | $20,100 |
| 2020 | $2,828 | $25,350 | $6,220 | $19,130 |
| 2019 | $2,834 | $25,350 | $6,220 | $19,130 |
| 2018 | $2,416 | $21,000 | $6,700 | $14,300 |
| 2017 | $2,197 | $21,000 | $6,700 | $14,300 |
| 2016 | $1,853 | $17,240 | $3,340 | $13,900 |
| 2015 | $1,850 | $17,240 | $3,340 | $13,900 |
| 2014 | $1,608 | $14,570 | $2,870 | $11,700 |
Source: Public Records
Map
Nearby Homes
- 12433 Bellaire Dr
- 12458 Albion St
- 12332 Colorado Blvd Unit 30
- 12312 Colorado Blvd Unit 10
- 12711 Colorado Blvd Unit 108A
- 12711 Colorado Blvd Unit 314C
- 12540 Dahlia Way
- 12791 Clermont St
- 4904 E 125th Ave
- 12426 Madison Way
- 4939 E 124th Way
- 12804 Harrison St
- 12698 Fairfax St
- 12672 Madison Ct
- 3991 E 121st Ave
- 5024 E 127th Way
- 4433 E 129th Ave
- 3765 E 127th Way
- 12506 Forest Dr
- 3670 E 128th Place
- 12564 Ash St
- 12568 Ash St
- 12553 Bellaire St
- 4291 E 125th Ave
- 12565 Bellaire St
- 4271 E 125th Ave
- 12552 Ash St
- 12528 Ash St
- 12574 Ash St
- 12577 Bellaire St
- 12586 Ash St
- 12516 Ash St
- 4251 E 125th Ave
- 12589 Bellaire St
- 12598 Ash St
- 12504 Ash St
- 12541 Bellaire St
- 4254 E 126th Ave
- 12540 Bellaire St
- 12551 Ash St
Your Personal Tour Guide
Ask me questions while you tour the home.