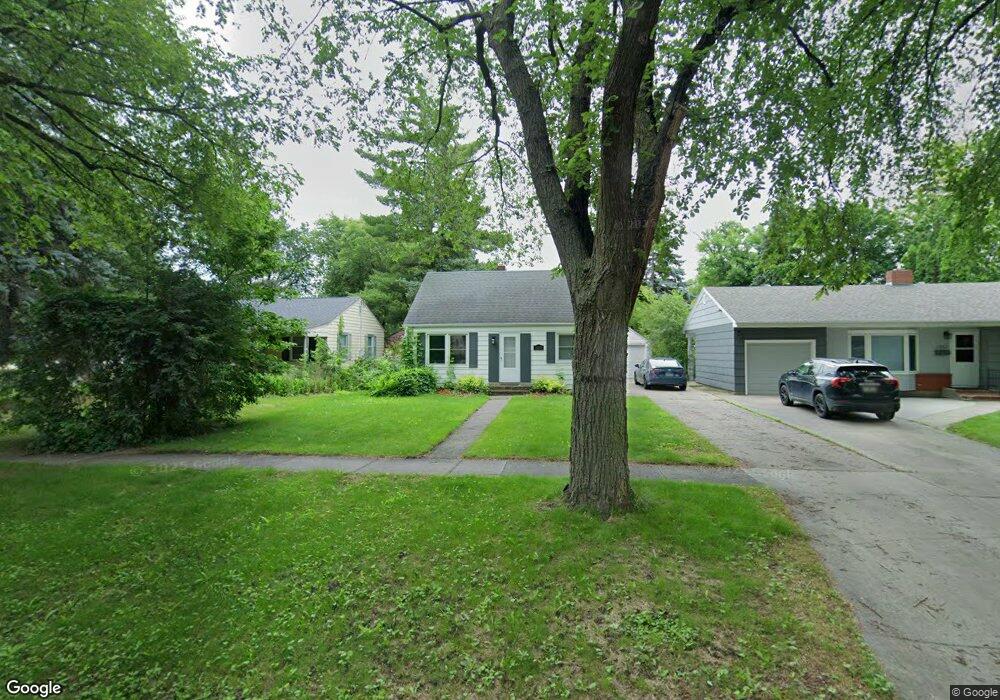
1257 8th St N Fargo, ND 58102
Roosevelt NeighborhoodEstimated Value: $166,713 - $241,000
3
Beds
1
Bath
1,020
Sq Ft
$204/Sq Ft
Est. Value
About This Home
This home is located at 1257 8th St N, Fargo, ND 58102 and is currently estimated at $208,178, approximately $204 per square foot. 1257 8th St N is a home located in Cass County with nearby schools including Horace Mann Roosevelt Elementary School, Ben Franklin Middle School, and North High School.
Ownership History
Date
Name
Owned For
Owner Type
Purchase Details
Closed on
Feb 27, 2014
Sold by
Johs Timothy J
Bought by
Thompson Zach
Current Estimated Value
Purchase Details
Closed on
Jun 19, 2012
Sold by
Cichos Paul D and Cichos Kayla A
Bought by
Johs Timothy J
Home Financials for this Owner
Home Financials are based on the most recent Mortgage that was taken out on this home.
Original Mortgage
$125,190
Interest Rate
4.1%
Mortgage Type
FHA
Create a Home Valuation Report for This Property
The Home Valuation Report is an in-depth analysis detailing your home's value as well as a comparison with similar homes in the area
Home Values in the Area
Average Home Value in this Area
Purchase History
| Date | Buyer | Sale Price | Title Company |
|---|---|---|---|
| Thompson Zach | $130,000 | Valley Title & Escrow | |
| Johs Timothy J | $127,500 | Title Co |
Source: Public Records
Mortgage History
| Date | Status | Borrower | Loan Amount |
|---|---|---|---|
| Previous Owner | Johs Timothy J | $125,190 |
Source: Public Records
Tax History Compared to Growth
Tax History
| Year | Tax Paid | Tax Assessment Tax Assessment Total Assessment is a certain percentage of the fair market value that is determined by local assessors to be the total taxable value of land and additions on the property. | Land | Improvement |
|---|---|---|---|---|
| 2024 | $1,642 | $79,800 | $20,400 | $59,400 |
| 2023 | $2,130 | $79,800 | $20,400 | $59,400 |
| 2022 | $2,165 | $79,800 | $20,400 | $59,400 |
| 2021 | $2,330 | $71,250 | $20,400 | $50,850 |
| 2020 | $2,305 | $71,250 | $20,400 | $50,850 |
| 2019 | $2,415 | $75,350 | $12,100 | $63,250 |
| 2018 | $2,391 | $75,350 | $12,100 | $63,250 |
| 2017 | $2,233 | $71,750 | $12,100 | $59,650 |
| 2016 | $1,969 | $67,050 | $12,100 | $54,950 |
| 2015 | $2,074 | $67,050 | $8,300 | $58,750 |
| 2014 | $1,617 | $47,650 | $8,300 | $39,350 |
| 2013 | $1,618 | $47,650 | $8,300 | $39,350 |
Source: Public Records
Map
Nearby Homes