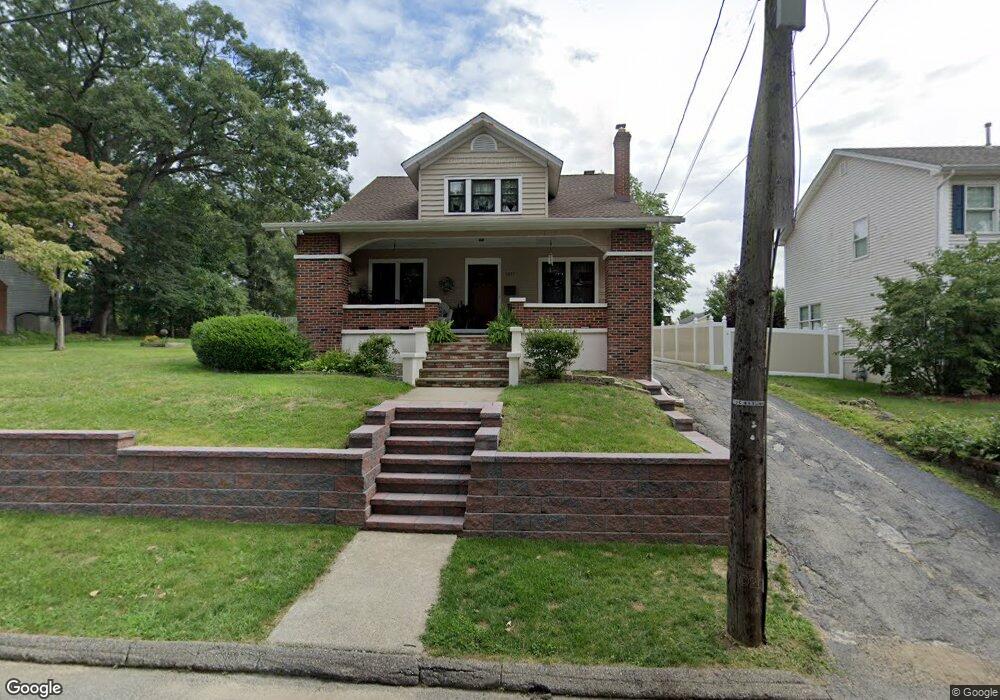
1257 Birch St Boonton, NJ 07005
Estimated Value: $634,000 - $805,000
--
Bed
--
Bath
2,168
Sq Ft
$315/Sq Ft
Est. Value
About This Home
This home is located at 1257 Birch St, Boonton, NJ 07005 and is currently estimated at $682,890, approximately $314 per square foot. 1257 Birch St is a home located in Morris County with nearby schools including School Street Elementary School, John Hill Elementary School, and Boonton High School.
Ownership History
Date
Name
Owned For
Owner Type
Purchase Details
Closed on
May 28, 1999
Sold by
Klisiewecz Mary
Bought by
Hengler Arthur J and Hengler Elaine K
Current Estimated Value
Home Financials for this Owner
Home Financials are based on the most recent Mortgage that was taken out on this home.
Original Mortgage
$144,000
Outstanding Balance
$37,352
Interest Rate
6.85%
Mortgage Type
Purchase Money Mortgage
Estimated Equity
$645,538
Create a Home Valuation Report for This Property
The Home Valuation Report is an in-depth analysis detailing your home's value as well as a comparison with similar homes in the area
Home Values in the Area
Average Home Value in this Area
Purchase History
| Date | Buyer | Sale Price | Title Company |
|---|---|---|---|
| Hengler Arthur J | $180,000 | -- |
Source: Public Records
Mortgage History
| Date | Status | Borrower | Loan Amount |
|---|---|---|---|
| Open | Hengler Arthur J | $144,000 |
Source: Public Records
Tax History Compared to Growth
Tax History
| Year | Tax Paid | Tax Assessment Tax Assessment Total Assessment is a certain percentage of the fair market value that is determined by local assessors to be the total taxable value of land and additions on the property. | Land | Improvement |
|---|---|---|---|---|
| 2025 | $13,767 | $407,300 | $180,000 | $227,300 |
| 2024 | $13,404 | $407,300 | $180,000 | $227,300 |
| 2023 | $13,404 | $407,300 | $180,000 | $227,300 |
| 2022 | $12,704 | $407,300 | $180,000 | $227,300 |
| 2021 | $12,704 | $407,300 | $180,000 | $227,300 |
| 2020 | $12,178 | $407,300 | $180,000 | $227,300 |
| 2019 | $12,337 | $407,300 | $180,000 | $227,300 |
| 2018 | $12,011 | $407,300 | $180,000 | $227,300 |
| 2017 | $11,327 | $400,800 | $180,000 | $220,800 |
| 2016 | $11,030 | $400,800 | $180,000 | $220,800 |
| 2015 | $10,850 | $400,800 | $180,000 | $220,800 |
| 2014 | $10,609 | $400,800 | $180,000 | $220,800 |
Source: Public Records
Map
Nearby Homes