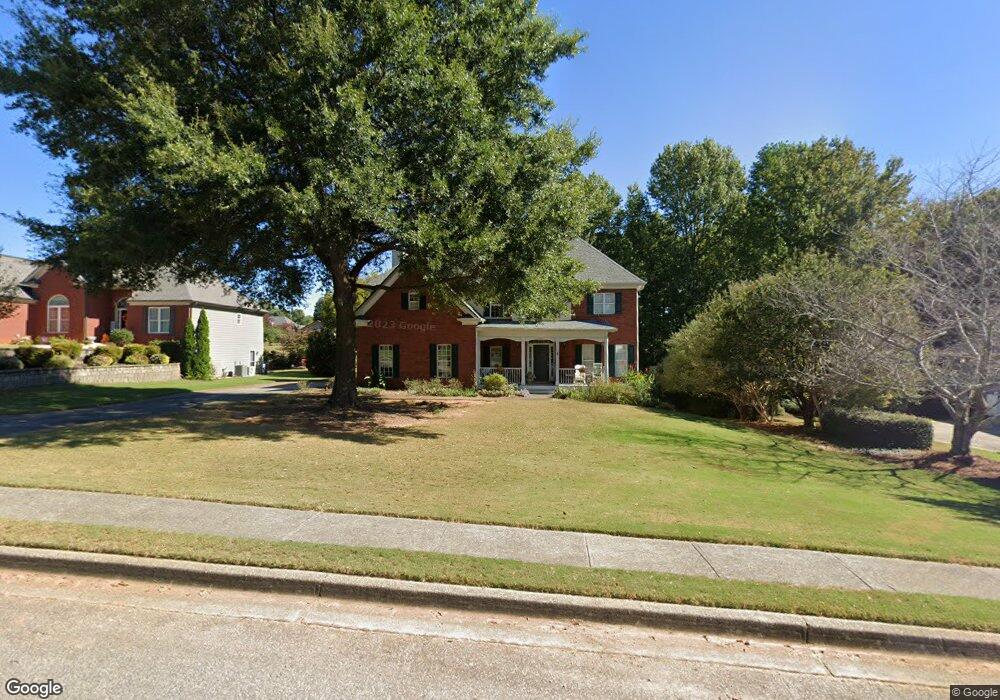
1257 Harvest Ln Hoschton, GA 30548
Estimated Value: $469,751 - $551,000
3
Beds
3
Baths
2,956
Sq Ft
$178/Sq Ft
Est. Value
About This Home
This home is located at 1257 Harvest Ln, Hoschton, GA 30548 and is currently estimated at $526,938, approximately $178 per square foot. 1257 Harvest Ln is a home located in Barrow County with nearby schools including Bramlett Elementary School, Russell Middle School, and Winder-Barrow High School.
Ownership History
Date
Name
Owned For
Owner Type
Purchase Details
Closed on
Dec 21, 2001
Sold by
Jennings Marc And
Bought by
Jennings Marc And
Current Estimated Value
Home Financials for this Owner
Home Financials are based on the most recent Mortgage that was taken out on this home.
Original Mortgage
$251,750
Outstanding Balance
$99,467
Interest Rate
6.72%
Mortgage Type
New Conventional
Estimated Equity
$427,471
Purchase Details
Closed on
Jul 7, 2000
Sold by
Jennings Marc
Bought by
Jennings Marc and Jennings Onda D
Home Financials for this Owner
Home Financials are based on the most recent Mortgage that was taken out on this home.
Original Mortgage
$219,950
Interest Rate
8.54%
Mortgage Type
New Conventional
Purchase Details
Closed on
Feb 3, 2000
Sold by
Sierra Development I
Bought by
Bui Hamilton and Bui Grace
Purchase Details
Closed on
Mar 12, 1998
Bought by
Sierra Development I
Create a Home Valuation Report for This Property
The Home Valuation Report is an in-depth analysis detailing your home's value as well as a comparison with similar homes in the area
Home Values in the Area
Average Home Value in this Area
Purchase History
| Date | Buyer | Sale Price | Title Company |
|---|---|---|---|
| Jennings Marc And | -- | -- | |
| Jennings Marc | -- | -- | |
| Jennings Marc | $231,600 | -- | |
| Bui Hamilton | $137,500 | -- | |
| Sierra Development I | -- | -- |
Source: Public Records
Mortgage History
| Date | Status | Borrower | Loan Amount |
|---|---|---|---|
| Open | Jennings Marc And | $251,750 | |
| Closed | Jennings Marc And | $251,750 | |
| Previous Owner | Jennings Marc | $219,950 |
Source: Public Records
Tax History Compared to Growth
Tax History
| Year | Tax Paid | Tax Assessment Tax Assessment Total Assessment is a certain percentage of the fair market value that is determined by local assessors to be the total taxable value of land and additions on the property. | Land | Improvement |
|---|---|---|---|---|
| 2024 | $3,906 | $175,224 | $32,000 | $143,224 |
| 2023 | $2,406 | $147,953 | $28,000 | $119,953 |
| 2022 | $3,321 | $124,098 | $28,000 | $96,098 |
| 2021 | $3,356 | $118,098 | $22,000 | $96,098 |
| 2020 | $3,262 | $114,098 | $18,000 | $96,098 |
| 2019 | $3,122 | $105,794 | $18,000 | $87,794 |
| 2018 | $2,992 | $101,642 | $18,000 | $83,642 |
| 2017 | $2,682 | $92,104 | $18,000 | $74,104 |
| 2016 | $2,639 | $89,910 | $22,000 | $67,910 |
| 2015 | $2,675 | $90,684 | $22,000 | $68,684 |
| 2014 | $2,468 | $82,084 | $9,996 | $72,088 |
| 2013 | -- | $74,363 | $9,996 | $64,367 |
Source: Public Records
Map
Nearby Homes
- 1376 Beringer Dr
- 1271 Harvest Ln
- 4525 Legacy Ct
- 951 Ardmore Tr
- 1011 Ardmore Trail
- 1203 Vintage Way
- 4828 Ardmore Ln
- 940 Chateau Forest Rd
- 4728 Ardmore Ln
- 4727 Ardmore Ln
- 1431 Winding Ridge Trail
- 1543 Maston Rd
- 1576 Maston Rd
- 29 Hydrangea Way Unit 72
- 5669 Legends Club Cir
- 5689 Wheeler Ridge Rd
- 5747 Wheeler Rd
- 5599 Wheeler Ridge Rd
- 2030 Havenhurst Way
- 1255 Harvest Ln
- 1261 Harvest Ln
- 1168 Vintage Way
- 1166 Vintage Way
- 1256 Harvest Ln
- 1253 Harvest Ln
- 1170 Vintage Way
- 1164 Vintage Way
- 1263 Harvest Ln
- 1260 Harvest Ln
- 1172 Vintage Way
- 1162 Vintage Way
- 1371 Beringer Dr
- 0 Harvest Ln Unit 3198324
- 0 Harvest Ln Unit 8781192
- 0 Harvest Ln Unit 8761659
- 0 Harvest Ln Unit 8484084
- 0 Harvest Ln
- 1373 Beringer Dr
- 1174 Vintage Way