Estimated Value: $551,000 - $812,216
4
Beds
3
Baths
3,000
Sq Ft
$235/Sq Ft
Est. Value
About This Home
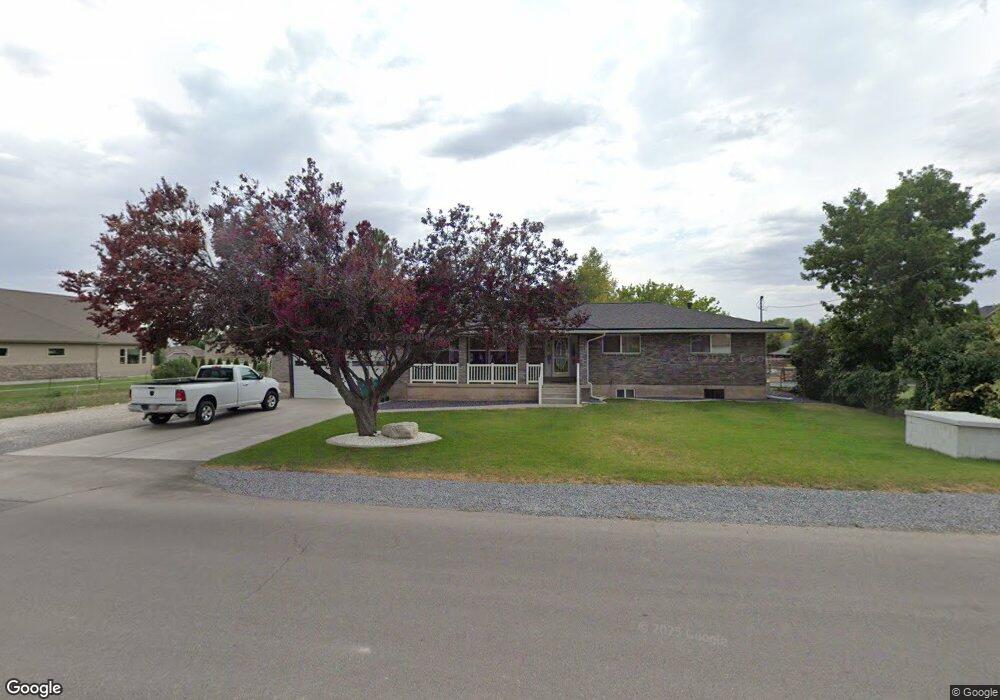
This home is located at 1257 N 1700 W, Lehi, UT 84043 and is currently estimated at $704,804, approximately $234 per square foot. 1257 N 1700 W is a home located in Utah County with nearby schools including North Point Elementary School, Willowcreek Middle School, and Lehi High School.
Ownership History
Date
Name
Owned For
Owner Type
Purchase Details
Closed on
Nov 3, 2020
Sold by
Barlow Lehi K
Bought by
Barlow Lehi K
Current Estimated Value
Home Financials for this Owner
Home Financials are based on the most recent Mortgage that was taken out on this home.
Original Mortgage
$342,000
Outstanding Balance
$247,555
Interest Rate
2.9%
Mortgage Type
New Conventional
Estimated Equity
$457,249
Purchase Details
Closed on
Oct 2, 2019
Sold by
Neerings Martha B
Bought by
Barlow Lehi K
Home Financials for this Owner
Home Financials are based on the most recent Mortgage that was taken out on this home.
Original Mortgage
$368,000
Interest Rate
3.5%
Mortgage Type
New Conventional
Purchase Details
Closed on
May 25, 2004
Sold by
Neerings Paul D
Bought by
Neerings Martha B
Home Financials for this Owner
Home Financials are based on the most recent Mortgage that was taken out on this home.
Original Mortgage
$159,555
Interest Rate
5.86%
Mortgage Type
Purchase Money Mortgage
Create a Home Valuation Report for This Property
The Home Valuation Report is an in-depth analysis detailing your home's value as well as a comparison with similar homes in the area
Home Values in the Area
Average Home Value in this Area
Purchase History
| Date | Buyer | Sale Price | Title Company |
|---|---|---|---|
| Barlow Lehi K | -- | Pinnacle Title | |
| Barlow Lehi K | -- | First American Title Ins Co | |
| Neerings Martha B | -- | Guardian Title Co Of Utah |
Source: Public Records
Mortgage History
| Date | Status | Borrower | Loan Amount |
|---|---|---|---|
| Open | Barlow Lehi K | $342,000 | |
| Closed | Barlow Lehi K | $368,000 | |
| Previous Owner | Neerings Martha B | $159,555 |
Source: Public Records
Tax History Compared to Growth
Tax History
| Year | Tax Paid | Tax Assessment Tax Assessment Total Assessment is a certain percentage of the fair market value that is determined by local assessors to be the total taxable value of land and additions on the property. | Land | Improvement |
|---|---|---|---|---|
| 2025 | $2,940 | $363,000 | $306,900 | $353,100 |
| 2024 | $2,940 | $344,080 | $0 | $0 |
| 2023 | $2,749 | $349,250 | $0 | $0 |
| 2022 | $2,974 | $366,300 | $0 | $0 |
| 2021 | $2,668 | $496,800 | $151,300 | $345,500 |
| 2020 | $2,515 | $463,000 | $140,100 | $322,900 |
| 2019 | $1,866 | $357,100 | $140,100 | $217,000 |
| 2018 | $1,844 | $333,600 | $130,100 | $203,500 |
| 2017 | $1,692 | $162,745 | $0 | $0 |
| 2016 | $1,541 | $137,500 | $0 | $0 |
| 2015 | $1,604 | $135,905 | $0 | $0 |
| 2014 | $1,455 | $122,485 | $0 | $0 |
Source: Public Records
Map
Nearby Homes
- 1659 W Boxwood Dr Unit 109
- 1627 W Boxwood Dr Unit 110
- 1127 N 1500 W
- 1132 Titan Dr
- 1032 Titan Dr
- 1542 N 1900 W
- 1332 W 1500 N
- 1094 W 1425 N
- 1249 W 1800 N
- 1272 W 1800 N
- 1610 N 1125 W
- 1908 N 2230 W
- 1896 N 2230 W
- 1302 N 2450 W
- 1301 N 900 W Unit 12
- 1970 N 2090 St W
- 902 W 1500 N
- Huntington Plan at Pioneer Meadows
- Silver Lake Plan at Pioneer Meadows
- Summit Plan at Pioneer Meadows