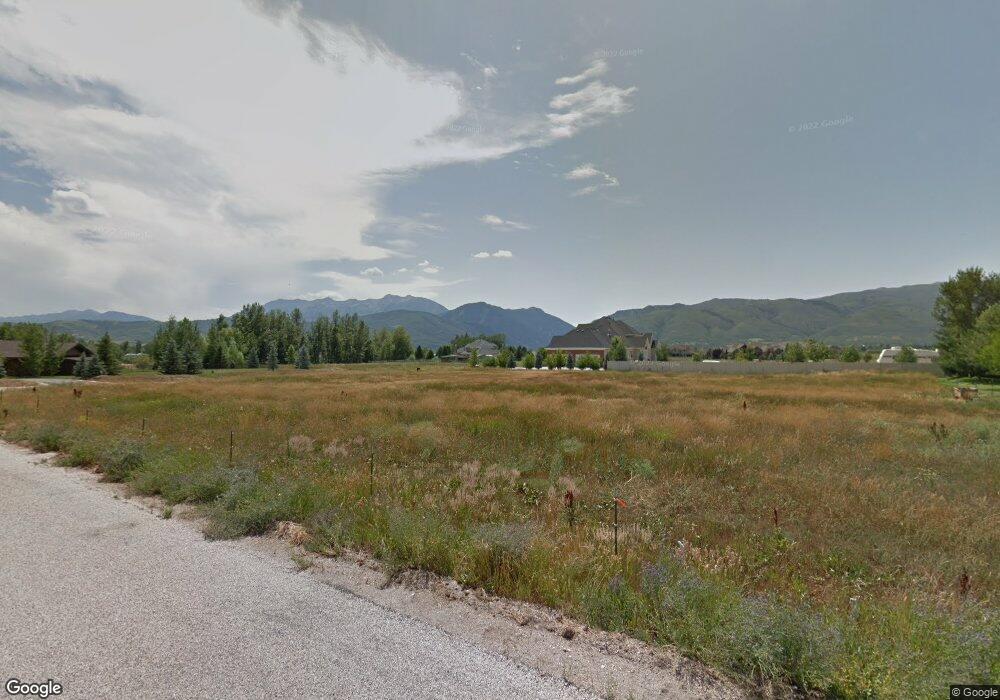
1257 N 7000 E Unit 18 Huntsville, UT 84317
Estimated Value: $2,093,000 - $2,808,000
3
Beds
3
Baths
5,343
Sq Ft
$455/Sq Ft
Est. Value
About This Home
This home is located at 1257 N 7000 E Unit 18, Huntsville, UT 84317 and is currently estimated at $2,429,717, approximately $454 per square foot. 1257 N 7000 E Unit 18 is a home located in Weber County with nearby schools including Valley Elementary School, Snowcrest Junior High School, and Weber High School.
Ownership History
Date
Name
Owned For
Owner Type
Purchase Details
Closed on
Oct 31, 2001
Sold by
Jensen Matthew C
Bought by
Jensen Matthew C and Jensen Heather
Current Estimated Value
Purchase Details
Closed on
Oct 22, 2001
Sold by
Holley Maryann Jackson and Holley Richard Glen
Bought by
Jensen Matthew C
Purchase Details
Closed on
Oct 10, 2000
Sold by
Holley Richard G and Holley Maryann J
Bought by
Holley Maryann Jackson and Holley Richard Glen
Purchase Details
Closed on
Jan 21, 2000
Sold by
Heritage Knoll Llc
Bought by
Holley Richard G and Holley Maryann J
Home Financials for this Owner
Home Financials are based on the most recent Mortgage that was taken out on this home.
Original Mortgage
$125,000
Interest Rate
7.87%
Mortgage Type
Seller Take Back
Create a Home Valuation Report for This Property
The Home Valuation Report is an in-depth analysis detailing your home's value as well as a comparison with similar homes in the area
Home Values in the Area
Average Home Value in this Area
Purchase History
| Date | Buyer | Sale Price | Title Company |
|---|---|---|---|
| Jensen Matthew C | -- | Mountain View Title | |
| Jensen Matthew C | -- | Mountain View Title | |
| Holley Maryann Jackson | -- | -- | |
| Holley Richard G | -- | Bonneville Title |
Source: Public Records
Mortgage History
| Date | Status | Borrower | Loan Amount |
|---|---|---|---|
| Previous Owner | Holley Richard G | $125,000 |
Source: Public Records
Tax History Compared to Growth
Tax History
| Year | Tax Paid | Tax Assessment Tax Assessment Total Assessment is a certain percentage of the fair market value that is determined by local assessors to be the total taxable value of land and additions on the property. | Land | Improvement |
|---|---|---|---|---|
| 2025 | $9,425 | $1,763,919 | $456,533 | $1,307,386 |
| 2024 | $8,680 | $1,655,999 | $456,562 | $1,199,437 |
| 2023 | $7,650 | $1,440,001 | $406,021 | $1,033,980 |
| 2022 | $8,179 | $1,569,062 | $381,005 | $1,188,057 |
| 2021 | $6,082 | $1,079,743 | $306,000 | $773,743 |
| 2020 | $5,680 | $928,000 | $182,500 | $745,500 |
| 2019 | $5,304 | $828,994 | $152,549 | $676,445 |
| 2018 | $5,495 | $824,034 | $152,549 | $671,485 |
| 2017 | $5,218 | $771,261 | $121,500 | $649,761 |
| 2016 | $1,505 | $121,500 | $121,500 | $0 |
| 2015 | $1,395 | $111,500 | $111,500 | $0 |
| 2014 | $1,408 | $110,000 | $110,000 | $0 |
Source: Public Records
Map
Nearby Homes
- 7768 E 1075 N
- 1762 N 6250 E Unit 5
- 1785 N 6250 E
- 1823 N 6250 E
- 260 S 7900 E
- 260 S 7900 E Unit 3
- 439 S 7900 E Unit 11
- 439 S 7900 E
- 387 S 7900 E
- 4400 Plan at SAGE
- 3500 Plan at SAGE
- 4200 Plan at SAGE
- 6486 E Highway 39 Unit 47
- 6486 E Highway 39 Unit 64
- 6486 E Highway 39 Unit 32
- 6486 E Highway 39 Unit 24
- 6486 E Hwy 39 Unit 47
- 6486 E Hwy 39 Unit 64
- 5223 N Harbor View Ct Unit 202
- 441 S 7900 E
- 1256 N 7000 E Unit 2
- 1256 N 7000 E Unit 2
- 1234 N 7000 E
- 1234 N 7000 E Unit 3
- 1287 N 7000 E
- 6958 E 1225 N
- 6993 E 1225 N
- 1290 N 7000 E
- 1290 N 7000 E Unit 17
- 1317 N 7000 E
- 1241 N 7100 E
- 6961 E 1225 N
- 6961 E 1225 N Unit 5
- 6959 E 1325 N
- 6959 E 1325 N Unit 21
- 1316 N 7000 E
- 1285 N 7100 E
- 1340 N 7000 E
- 1340 N 7000 E Unit 15
- 6962 E 1325 N