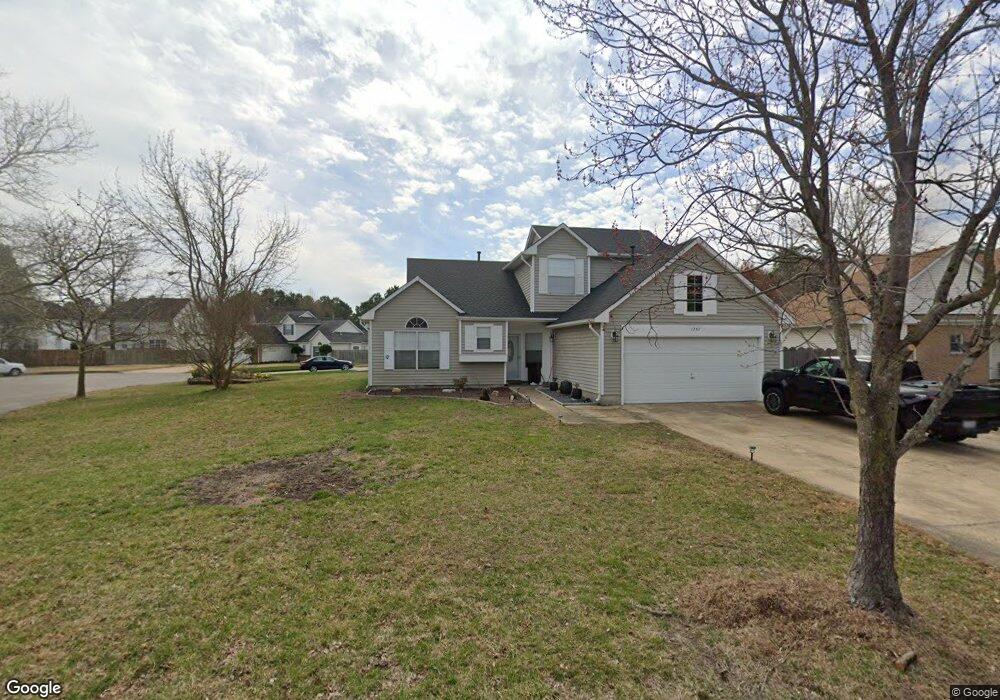
1257 Raynor Dr Virginia Beach, VA 23456
Estimated Value: $462,000 - $538,000
4
Beds
3
Baths
1,800
Sq Ft
$276/Sq Ft
Est. Value
About This Home
This home is located at 1257 Raynor Dr, Virginia Beach, VA 23456 and is currently estimated at $496,784, approximately $275 per square foot. 1257 Raynor Dr is a home located in Virginia Beach City with nearby schools including Glenwood Elementary School, Salem Middle School, and Salem High School.
Ownership History
Date
Name
Owned For
Owner Type
Purchase Details
Closed on
May 7, 2024
Sold by
Dugan David L
Bought by
Taherv Mohammed Et
Current Estimated Value
Home Financials for this Owner
Home Financials are based on the most recent Mortgage that was taken out on this home.
Original Mortgage
$441,086
Outstanding Balance
$434,794
Interest Rate
6.79%
Mortgage Type
FHA
Estimated Equity
$61,990
Purchase Details
Closed on
Nov 21, 2023
Sold by
Caymus Cash Buyers Llc
Bought by
Dugan David L
Purchase Details
Closed on
Nov 20, 2023
Sold by
Janifer Sequona L and Janifer Sequana L
Bought by
Caymus Cash Buyers Llc
Purchase Details
Closed on
Aug 27, 2012
Sold by
Hundley Alonza B
Bought by
Janifer Sequona L
Home Financials for this Owner
Home Financials are based on the most recent Mortgage that was taken out on this home.
Original Mortgage
$175,500
Interest Rate
3.56%
Mortgage Type
New Conventional
Purchase Details
Closed on
Oct 6, 2000
Sold by
Vess Wendell L
Bought by
Hundley Alonza B
Create a Home Valuation Report for This Property
The Home Valuation Report is an in-depth analysis detailing your home's value as well as a comparison with similar homes in the area
Home Values in the Area
Average Home Value in this Area
Purchase History
| Date | Buyer | Sale Price | Title Company |
|---|---|---|---|
| Taherv Mohammed Et | $510,000 | Old Republic Title | |
| Dugan David L | $332,000 | Fidelity National Title | |
| Caymus Cash Buyers Llc | $290,000 | Seashore Title | |
| Janifer Sequona L | $175,000 | -- | |
| Hundley Alonza B | $161,500 | -- |
Source: Public Records
Mortgage History
| Date | Status | Borrower | Loan Amount |
|---|---|---|---|
| Open | Taherv Mohammed Et | $441,086 | |
| Previous Owner | Janifer Sequona L | $175,500 |
Source: Public Records
Tax History Compared to Growth
Tax History
| Year | Tax Paid | Tax Assessment Tax Assessment Total Assessment is a certain percentage of the fair market value that is determined by local assessors to be the total taxable value of land and additions on the property. | Land | Improvement |
|---|---|---|---|---|
| 2025 | $3,797 | $448,800 | $170,000 | $278,800 |
| 2024 | $3,797 | $391,400 | $160,000 | $231,400 |
| 2023 | $3,662 | $369,900 | $135,000 | $234,900 |
| 2022 | $3,282 | $331,500 | $115,500 | $216,000 |
| 2021 | $3,036 | $306,700 | $105,000 | $201,700 |
| 2020 | $2,840 | $279,100 | $95,000 | $184,100 |
| 2019 | $2,884 | $278,100 | $93,000 | $185,100 |
| 2018 | $2,788 | $278,100 | $93,000 | $185,100 |
| 2017 | $2,717 | $271,000 | $91,000 | $180,000 |
| 2016 | $2,638 | $266,500 | $89,000 | $177,500 |
| 2015 | $2,513 | $253,800 | $85,000 | $168,800 |
| 2014 | $2,270 | $242,700 | $105,000 | $137,700 |
Source: Public Records
Map
Nearby Homes
- 1292 Raynor Dr
- 4660 Indian River Rd
- 4668 Indian River Rd
- 2017 Southaven Dr
- 2008 Hopi Ct
- 4740 Kilby Dr Unit 10
- 1536 Drumheller Dr
- 2148 Dove Ridge Dr
- 4528 Medford Ct
- 1981 Gravenhurst Dr
- 4325 Danali Ln
- 4337 Danali Ln
- 2601 Larchwood Cove
- 1936 Southaven Dr
- 2100 Rydale Ct
- 2020 Lyndora Rd
- 1232 Northvale Dr
- 1341 Sagamore Ct
- 1421 Eddystone Dr Unit X9192
- 2708 Ada Arch