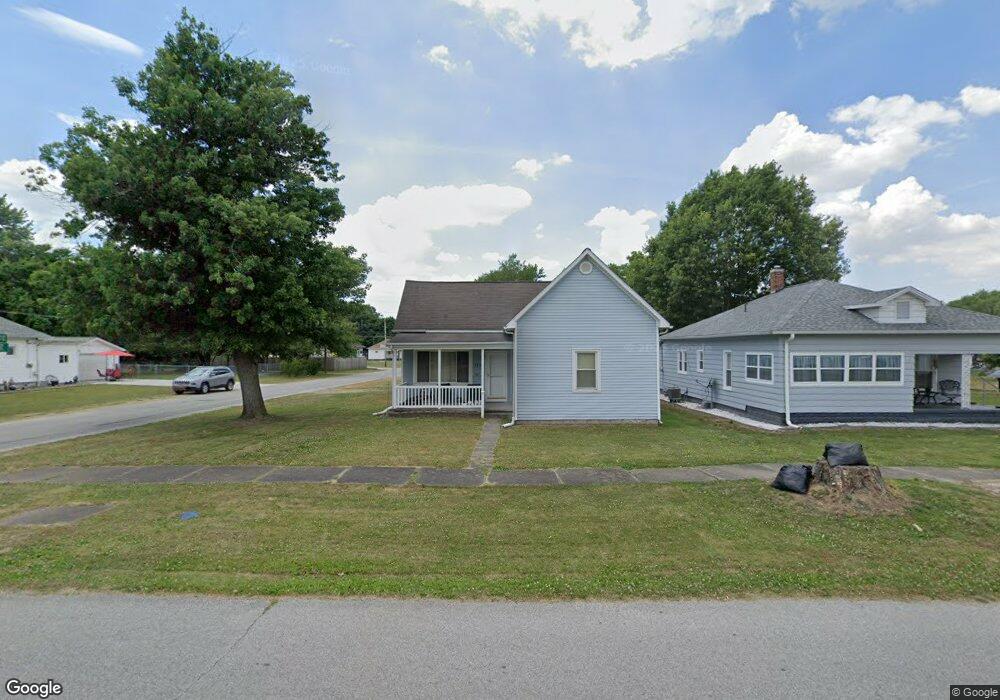
1257 S 3rd St Clinton, IN 47842
Estimated Value: $92,000 - $115,000
3
Beds
1
Bath
1,420
Sq Ft
$77/Sq Ft
Est. Value
About This Home
This home is located at 1257 S 3rd St, Clinton, IN 47842 and is currently estimated at $109,047, approximately $76 per square foot. 1257 S 3rd St is a home located in Vermillion County with nearby schools including South Vermillion High School and Sacred Heart School.
Ownership History
Date
Name
Owned For
Owner Type
Purchase Details
Closed on
Jun 7, 2021
Sold by
Cammack Real Estate Llc
Bought by
Fisher Mark Andrew
Current Estimated Value
Home Financials for this Owner
Home Financials are based on the most recent Mortgage that was taken out on this home.
Original Mortgage
$62,605
Outstanding Balance
$56,681
Interest Rate
2.9%
Mortgage Type
New Conventional
Estimated Equity
$52,366
Purchase Details
Closed on
Oct 31, 2017
Sold by
Cammack Kent A and Cammack Cynthia A
Bought by
Cammack Real Estate Llc
Purchase Details
Closed on
Dec 2, 2011
Sold by
Stoffel Curtis A and Stoffel Marissa M
Bought by
Cammack Kent and Cammack Cynthia
Create a Home Valuation Report for This Property
The Home Valuation Report is an in-depth analysis detailing your home's value as well as a comparison with similar homes in the area
Home Values in the Area
Average Home Value in this Area
Purchase History
| Date | Buyer | Sale Price | Title Company |
|---|---|---|---|
| Fisher Mark Andrew | -- | None Available | |
| Cammack Real Estate Llc | -- | -- | |
| Cammack Kent | $59,000 | -- | |
| Cammack Kent | $59,000 | -- |
Source: Public Records
Mortgage History
| Date | Status | Borrower | Loan Amount |
|---|---|---|---|
| Open | Fisher Mark Andrew | $62,605 |
Source: Public Records
Tax History Compared to Growth
Tax History
| Year | Tax Paid | Tax Assessment Tax Assessment Total Assessment is a certain percentage of the fair market value that is determined by local assessors to be the total taxable value of land and additions on the property. | Land | Improvement |
|---|---|---|---|---|
| 2024 | $678 | $76,500 | $11,600 | $64,900 |
| 2023 | $640 | $68,300 | $11,600 | $56,700 |
| 2022 | $559 | $68,900 | $11,600 | $57,300 |
| 2021 | $360 | $36,200 | $14,300 | $21,900 |
| 2020 | $724 | $36,200 | $14,300 | $21,900 |
| 2019 | $798 | $39,900 | $6,200 | $33,700 |
| 2018 | $714 | $35,700 | $6,200 | $29,500 |
| 2017 | $704 | $35,200 | $6,200 | $29,000 |
| 2016 | $686 | $34,300 | $6,200 | $28,100 |
| 2014 | $670 | $33,500 | $6,200 | $27,300 |
| 2013 | $670 | $33,500 | $6,200 | $27,300 |
Source: Public Records
Map
Nearby Homes
- 0 S Main St
- 1409 S 4th St
- 947 S Main St
- 1025 S 6th St
- 1400 S 8th St
- 734 S 6th St
- 525 S 4th St
- 660 Mulberry St
- 559 Mulberry St
- 1059 Blackman St
- 1146 Blackman St
- 2359 E St Rd 163
- 359 N 3rd St
- 522 N Main St
- 626 N Main St
- 15034 S Willow Grove Ave
- 821 N 8th St
- 945 Morey St
- 1102 Matthews St
- 1095 Oakridge Dr