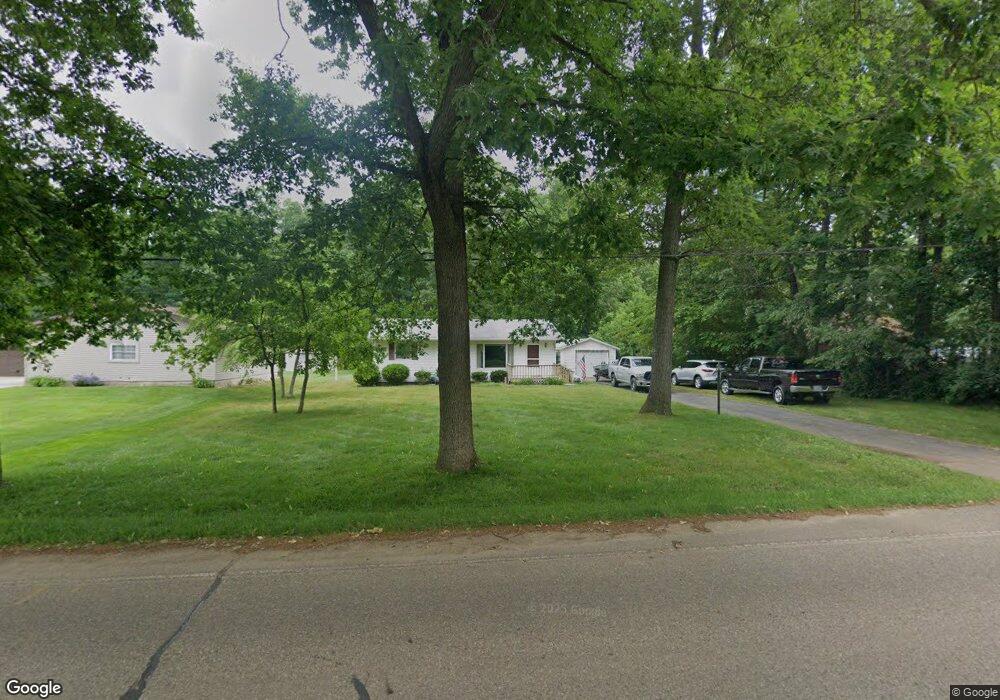
1258 Bridge Rd Allegan, MI 49010
Estimated Value: $300,000 - $351,000
2
Beds
2
Baths
1,522
Sq Ft
$206/Sq Ft
Est. Value
About This Home
This home is located at 1258 Bridge Rd, Allegan, MI 49010 and is currently estimated at $313,987, approximately $206 per square foot. 1258 Bridge Rd is a home located in Allegan County with nearby schools including Pine Trails Elementary School, L.E. White Middle School, and Allegan High School.
Ownership History
Date
Name
Owned For
Owner Type
Purchase Details
Closed on
May 1, 2017
Sold by
Cherry Chase
Bought by
Redisi Gary L and Redisi Patricia A
Current Estimated Value
Home Financials for this Owner
Home Financials are based on the most recent Mortgage that was taken out on this home.
Original Mortgage
$134,310
Outstanding Balance
$111,818
Interest Rate
4.14%
Mortgage Type
FHA
Estimated Equity
$202,169
Purchase Details
Closed on
May 30, 2014
Sold by
Anne Helen Wickizer Revocable Living Tru
Bought by
Cherry Chase
Home Financials for this Owner
Home Financials are based on the most recent Mortgage that was taken out on this home.
Original Mortgage
$119,352
Interest Rate
4.34%
Mortgage Type
FHA
Purchase Details
Closed on
Oct 16, 2012
Sold by
Wickizer Anne Helen
Bought by
The Anne Helen Wickizer Revocable Living
Purchase Details
Closed on
Mar 9, 2012
Sold by
Christman Dale Richarde and Christman Susanna
Bought by
Wickizer Anne Helen
Create a Home Valuation Report for This Property
The Home Valuation Report is an in-depth analysis detailing your home's value as well as a comparison with similar homes in the area
Home Values in the Area
Average Home Value in this Area
Purchase History
| Date | Buyer | Sale Price | Title Company |
|---|---|---|---|
| Redisi Gary L | $152,000 | Chicago Title Of Mi Inc | |
| Cherry Chase | $127,700 | Chicago Title | |
| The Anne Helen Wickizer Revocable Living | -- | None Available | |
| Wickizer Anne Helen | $118,000 | Chicago Title |
Source: Public Records
Mortgage History
| Date | Status | Borrower | Loan Amount |
|---|---|---|---|
| Open | Redisi Gary L | $134,310 | |
| Previous Owner | Cherry Chase | $119,352 |
Source: Public Records
Tax History Compared to Growth
Tax History
| Year | Tax Paid | Tax Assessment Tax Assessment Total Assessment is a certain percentage of the fair market value that is determined by local assessors to be the total taxable value of land and additions on the property. | Land | Improvement |
|---|---|---|---|---|
| 2025 | $3,325 | $136,000 | $19,500 | $116,500 |
| 2024 | $3,022 | $132,700 | $17,300 | $115,400 |
| 2023 | $3,022 | $118,500 | $14,200 | $104,300 |
| 2022 | $3,022 | $101,800 | $16,700 | $85,100 |
| 2021 | $2,808 | $91,700 | $17,300 | $74,400 |
| 2020 | $2,808 | $88,200 | $15,000 | $73,200 |
| 2019 | $0 | $84,600 | $16,900 | $67,700 |
| 2018 | $0 | $81,000 | $17,700 | $63,300 |
| 2017 | $0 | $83,400 | $18,000 | $65,400 |
| 2016 | $0 | $74,300 | $11,300 | $63,000 |
| 2015 | -- | $74,300 | $11,300 | $63,000 |
| 2014 | -- | $58,600 | $10,700 | $47,900 |
| 2013 | -- | $60,900 | $8,600 | $52,300 |
Source: Public Records
Map
Nearby Homes
- 3036 Primrose Place
- V/L Marshall St
- 3138 Valley Vista Ln
- 171 Thomas St
- 1077 Sun Valley Ln
- 322 Thomas St
- 0 113th Ave
- 143 Ely St
- 124 Park Ave
- 616 Beechwood Dr
- 369 Thomas St
- V/L Springhill Dr
- 521 Trowbridge St
- 404 Academy St
- 215 James St
- 221 James St
- 111 River St
- 318 Cutler St
- 1269 Highland Ct
- Lot 18 Conley Dr
- 1260 Bridge Rd
- 1256 Bridge Rd
- 1265 Bridge Rd
- 1264 Bridge Rd
- 1257 Bridge Rd
- 1257 Bridge Rd
- 1252 Bridge Rd
- 1259 Bridge Rd
- 1263 Bridge Rd
- 1268 Bridge Rd
- 1270 Bridge Rd
- 1250 Bridge Rd
- 1261 Bridge Rd
- 1247 Wallace Dr
- 1275 Bridge Rd
- 1253 Wallace Dr
- 1246 Bridge Rd
- 2985 Oaktree Ln
- 1257 Wallace Dr
- 1283 Bridge Rd