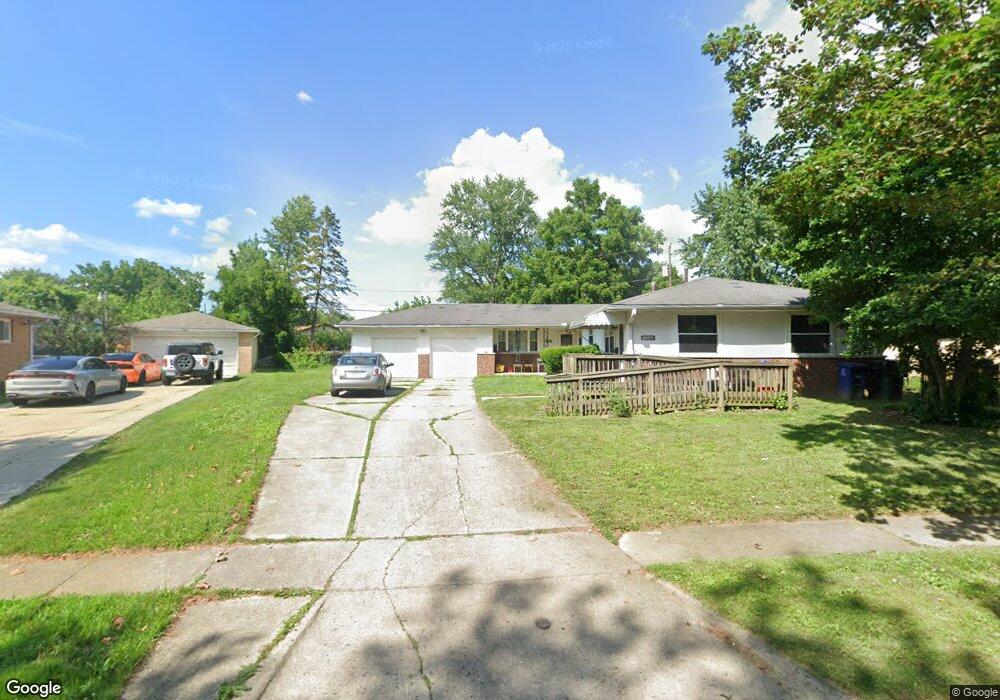
1258 Fenceway Dr Columbus, OH 43229
Woodward Park NeighborhoodEstimated Value: $318,998 - $355,000
6
Beds
3
Baths
2,102
Sq Ft
$158/Sq Ft
Est. Value
About This Home
This home is located at 1258 Fenceway Dr, Columbus, OH 43229 and is currently estimated at $332,500, approximately $158 per square foot. 1258 Fenceway Dr is a home located in Franklin County with nearby schools including Valley Forge Elementary School, Woodward Park Middle School, and Northland High School.
Ownership History
Date
Name
Owned For
Owner Type
Purchase Details
Closed on
Jan 20, 2006
Sold by
Connor Holly Trinity Rentals Llc
Bought by
Little Thearthur and Little Diana
Current Estimated Value
Home Financials for this Owner
Home Financials are based on the most recent Mortgage that was taken out on this home.
Original Mortgage
$60,000
Outstanding Balance
$33,585
Interest Rate
6.2%
Mortgage Type
Fannie Mae Freddie Mac
Estimated Equity
$298,915
Purchase Details
Closed on
Dec 23, 2003
Sold by
Connor Michael J
Bought by
Connor Holy Trinity Rentals Llc
Purchase Details
Closed on
Jun 12, 2000
Sold by
Roberts Ralph V and Roberts Melinda M
Bought by
Connor Michael J
Home Financials for this Owner
Home Financials are based on the most recent Mortgage that was taken out on this home.
Original Mortgage
$112,000
Interest Rate
8.14%
Purchase Details
Closed on
Jan 14, 1985
Bought by
Roberts Ralph
Create a Home Valuation Report for This Property
The Home Valuation Report is an in-depth analysis detailing your home's value as well as a comparison with similar homes in the area
Home Values in the Area
Average Home Value in this Area
Purchase History
| Date | Buyer | Sale Price | Title Company |
|---|---|---|---|
| Little Thearthur | $154,000 | Chicago | |
| Connor Holy Trinity Rentals Llc | -- | -- | |
| Connor Michael J | $125,000 | Connor Title Co | |
| Roberts Ralph | $82,000 | -- |
Source: Public Records
Mortgage History
| Date | Status | Borrower | Loan Amount |
|---|---|---|---|
| Open | Little Thearthur | $60,000 | |
| Previous Owner | Connor Michael J | $112,000 |
Source: Public Records
Tax History Compared to Growth
Tax History
| Year | Tax Paid | Tax Assessment Tax Assessment Total Assessment is a certain percentage of the fair market value that is determined by local assessors to be the total taxable value of land and additions on the property. | Land | Improvement |
|---|---|---|---|---|
| 2024 | $4,429 | $96,640 | $22,020 | $74,620 |
| 2023 | $4,374 | $96,635 | $22,015 | $74,620 |
| 2022 | $2,936 | $55,240 | $13,900 | $41,340 |
| 2021 | $2,941 | $55,240 | $13,900 | $41,340 |
| 2020 | $2,909 | $55,240 | $13,900 | $41,340 |
| 2019 | $2,714 | $44,180 | $11,100 | $33,080 |
| 2018 | $2,822 | $44,180 | $11,100 | $33,080 |
| 2017 | $2,910 | $44,180 | $11,100 | $33,080 |
| 2016 | $3,058 | $44,840 | $9,800 | $35,040 |
| 2015 | $2,785 | $44,840 | $9,800 | $35,040 |
| 2014 | $2,742 | $44,840 | $9,800 | $35,040 |
| 2013 | $1,534 | $49,210 | $10,290 | $38,920 |
Source: Public Records
Map
Nearby Homes
- 4840 Almont Dr
- 1125 Upland Dr
- 1116 Tulsa Dr
- 4904 Almont Dr
- 1266 Pershing Dr
- 4791 Bourke Rd
- 1414 Alvina Dr
- 4815 Bourke Rd
- 4800 Bourke Rd
- 4761 Colonel Perry Dr
- 4816 Bourke Rd
- 4983 Almont Dr
- 1071 Loring Rd
- 4852 Colonel Perry Dr
- 4455 Kenfield Rd
- 1385 Thurell Rd
- 1485 Norma Rd
- 4441 Wetmore Rd E
- 4923 Karl Rd Unit 4925
- 1191 Bryson Rd
- 1264 Fenceway Dr Unit 266
- 1264-1266 Fenceway Dr
- 1250 Fenceway Dr
- 4732 Maize Rd
- 1265 Maize Ct
- 1279 Maize Ct
- 1291 Maize Ct
- 1270 Fenceway Dr Unit 272
- 1253 Maize Ct
- 1297 Maize Ct
- 1282 Fenceway Dr Unit 284
- 1282-1284 Fenceway Dr
- 1260 Morse Rd
- 4727 Maize Rd Unit 729
- 1299 Maize Ct
- 4711 Maize Rd Unit 713
- 4737 Maize Rd
- 1292 Fenceway Dr Unit 294
- 1254 Maize Ct
- 1234 Morse Rd