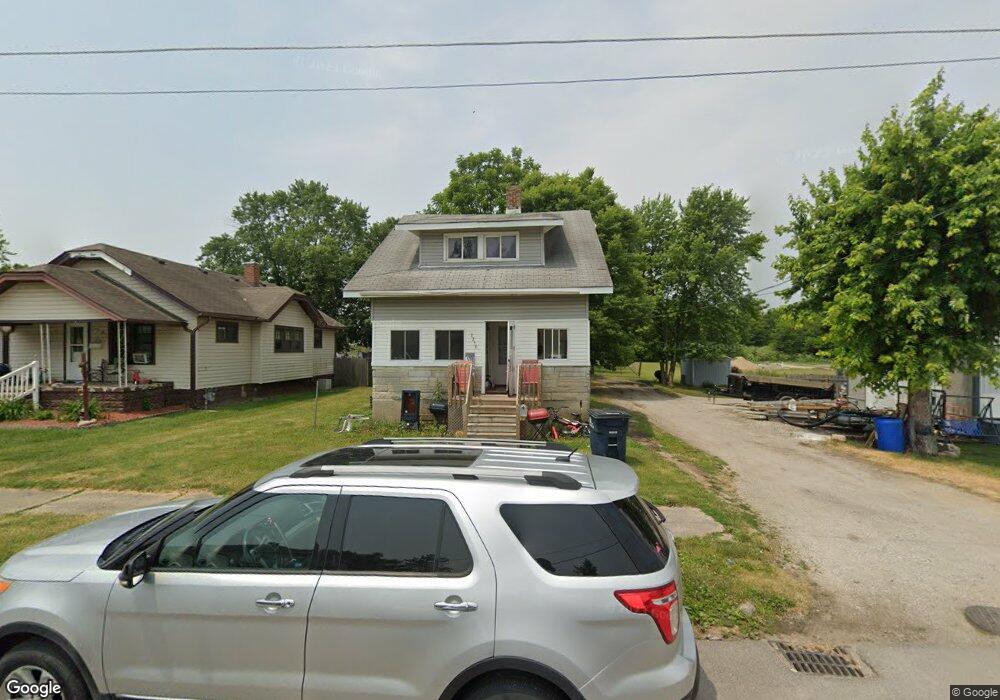
1258 John St Frankfort, IN 46041
Estimated Value: $147,000 - $206,000
3
Beds
2
Baths
1,142
Sq Ft
$144/Sq Ft
Est. Value
About This Home
This home is located at 1258 John St, Frankfort, IN 46041 and is currently estimated at $164,628, approximately $144 per square foot. 1258 John St is a home located in Clinton County with nearby schools including Frankfort Senior High School and Frankfort Covenant Academy.
Ownership History
Date
Name
Owned For
Owner Type
Purchase Details
Closed on
Oct 31, 2005
Sold by
Walker Jeffery A
Bought by
Barker Spencer D
Current Estimated Value
Purchase Details
Closed on
Jan 14, 2005
Sold by
Citifinancial Mortgage Company Inc
Bought by
Walker Jeffrey A
Purchase Details
Closed on
Mar 3, 2000
Sold by
Painter Carole E
Bought by
Pillion Kathleen
Create a Home Valuation Report for This Property
The Home Valuation Report is an in-depth analysis detailing your home's value as well as a comparison with similar homes in the area
Home Values in the Area
Average Home Value in this Area
Purchase History
| Date | Buyer | Sale Price | Title Company |
|---|---|---|---|
| Barker Spencer D | -- | None Available | |
| Walker Jeffrey A | -- | Us Title | |
| Pillion Kathleen | $82,500 | -- |
Source: Public Records
Tax History Compared to Growth
Tax History
| Year | Tax Paid | Tax Assessment Tax Assessment Total Assessment is a certain percentage of the fair market value that is determined by local assessors to be the total taxable value of land and additions on the property. | Land | Improvement |
|---|---|---|---|---|
| 2024 | $2,319 | $102,800 | $7,100 | $95,700 |
| 2023 | $2,046 | $89,000 | $7,100 | $81,900 |
| 2022 | $1,674 | $73,200 | $7,100 | $66,100 |
| 2021 | $1,431 | $62,000 | $7,100 | $54,900 |
| 2020 | $1,463 | $62,000 | $7,100 | $54,900 |
| 2019 | $1,465 | $62,000 | $7,100 | $54,900 |
| 2018 | $1,449 | $62,000 | $7,100 | $54,900 |
| 2017 | $1,461 | $61,800 | $6,900 | $54,900 |
| 2016 | $1,419 | $59,300 | $6,900 | $52,400 |
| 2014 | $1,172 | $58,600 | $6,900 | $51,700 |
Source: Public Records
Map
Nearby Homes
- 756 Delphi Ave
- 450 W Green St
- 1059 N Main St
- 557 W Green St
- 902 Rossville Ave
- 10 E Green St
- 907 Rowe St
- 951 W Paris St
- 1300 Myrtle Ave
- 952 Given St
- 1159 W Mcclurg St
- 751 Woodland Ct
- 250 252 W Washington St
- 250 , 252 W Washington St
- 506 W Walnut St
- 1401 W Morrison St
- 255 N East St
- 1209 E Wabash St
- 707 Blinn Ave
- 359 S 2nd St